


 nueva página del texto (beta)
 Inglés (pdf)
 Artículo en XML
 Referencias del artículo
 Enviar artículo por email
 Citado por SciELO
  Similares en
SciELO
Similares en
SciELO 
 Permalink
1.Introduction
It has been known for a long time that there is a strong correlation between galaxy age and local density: galaxies in low-density regions are generally younger than galaxies in high-density regions (e.g., Bernardi et al. 1998; Trager et al. 2000; Kuntschner et al. 2002; Terlevich & Forbes 2002; Proctor et al. 2004; Mendes de Oliveira et al. 2005; Thomas et al. 2005; Gallazzi et al. 2006; Sánchez-Blázquez et al. 2006; Siĺchenko 2006; Rakos et al. 2007; Reed et al. 2007; Wegner & Grogin 2008; Smith et al. 2012; Deng 2014). For example, Kuntschner et al. (2002) reported that at a given luminosity, the E/S0 galaxies in low-density regions are ≈ 2-3 Gyr younger than the E/S0s in clusters. Smith et al. (2012) explored the variation in stellar population ages for Coma Cluster galaxies as a function of projected cluster-centric distance, and found that the average age of dwarfs at the 2.5 Mpc limit of their sample is approximately half that of dwarfs near the cluster centre. In two volume-limited Main Galaxy (Strauss et al. 2002) samples of the Sloan Digital Sky Survey Data Release 10 (SDSS DR10) (Ahn et al. 2014), Deng (2014) investigated the environmental dependence of galaxy age, and obtained the same conclusions in two volume-limited Main Galaxy samples: old galaxies exist preferentially in the densest regions of the universe, while young galaxies are located preferentially in low density regions. Such a conclusion is in good agreement with the current hierarchical assembly paradigm, which predicts a younger age of galaxies in lower density environments (e.g., Lanzoni et al. 2005; De Lucia et al. 2006).
Many works shed light on the dependence of the clustering properties of galaxies on various galaxy parameters (Davis & Geller 1976; Loveday et al. 1995; Brown et al. 2000; Norberg et al. 2001, 2002; Zehavi et al. 2002, 2005, 2011; Zheng et al. 2007, 2009; Loh et al. 2010; Tinker et al. 2010; Wang et al. 2011; Deng 2013). For example, Brown et al. (2000) reported a strong dependence of the clustering properties of galaxies on their colors. Norberg et al. (2001, 2002) demonstrated that the clustering amplitude of the correlation function of galaxies increases with absolute magnitude. Using cluster analysis (Einasto et al. 1984), Deng et al. (2016) explored the dependence of the clustering properties of galaxies on galaxy age, and concluded that young galaxies preferentially form isolated galaxies, close pairs and small groups at all scales, whereas old galaxies preferentially inhabit dense groups and clusters. This actually showed the environmental dependence of galaxy age by an alternative approach.
In the last several decades, many works have focused on the study of active galactic nuclei (AGNs) (Dressler et al. 1985; Miller et al. 2003; Krumpe et al. 2012; Enoki et al. 2014; Kagaya et al. 2017; Chen et al. 2018; Liu et al. 2019; Zou et al. 2019). Dressler et al. (1985) and Miller et al. (2003) explored the correlation between the presence of AGNs and the local environment of AGN host galaxies. Krumpe et al. (2012) measured the clustering amplitudes of both X-ray-selected and optically selected SDSS broad-line AGNs. Enoki et al. (2014) presented the AGN space density evolution predicted by a semi-analytic model of galaxy and AGN formation based on the hierarchical structure formation scenario. Kagaya et al. (2017) investigated the possibility of acceleration of ultra-high-energy cosmic rays (UHECRs) in nearby AGNs. Chen et al. (2018) studied how to quantify the systematic differences resulting from using different stellar population models (SPM) in optical spectroscopic identification of type II AGNs. Zou et al. (2019) confirmed the prediction of the unified model of AGNs. Liu et al. (2019) presented a new, complete sample of 14,584 broad-line AGNs at z < 0.35 .
The primary goal of this study is to explore the environmental dependence of the galaxy age for the active galaxy samples, and to examine the dependence of the clustering properties of active galaxies on age. The outline of this paper is as follows. In § 2, we describe the active galaxy samples. We present statistical results in § 3 and § 4. We summarize our main results and conclusions in § 5.
To calculate the distance, we used a cosmological model with a matter density of
Ω0 = 0.3 , a cosmological constant of
2.Data
Data Release 12 (DR12) (Alam et al. 2015) of
the SDSS is the final public release of spectroscopic data from the SDSS-III BOSS.
In this work, the data of the Main Galaxy sample (Strauss et al. 2002) was downloaded from the Catalog Archive Server of
SDSS Data Release 12 (Alam et al. 2015) by the
SDSS SQL Search (with SDSS flag: LEGACY_TARGET1 & (64 | 128 | 256) > 0). We
extracted 631968 main galaxies with spectroscopic redshifts 0.02
Two template fittings (passive and star-forming) and two adopted initial mass functions (IMFs) (Salpeter and Kroupa) were employed by Maraston et al. (2013). In this work, we use best-fit age of galaxy [in Gyr] obtained with the star-forming template and the Kroupa IMF (Maraston et al. 2013). Thus, the data set of age measurement stems from the StellarMassStarFormingPort table (http://www.sdss3.org/dr12/).
The galSpecExtra table contains estimated parameters for all galaxies in the MPA-JHU spectroscopic catalogue. BPT classification in this table is based on the methodology of Brinchmann et al. (2004):
All. The set of all galaxies in the sample regardless of the S/N of their emission lines.
SF. The star-forming galaxies. These are the galaxies with S/N > 3 in all four BPT lines that lie below the lower line in Figure 1 of Brinchmann et al. (2004). This lower line is taken from equation (1) of Kauffmann et al. (2003).
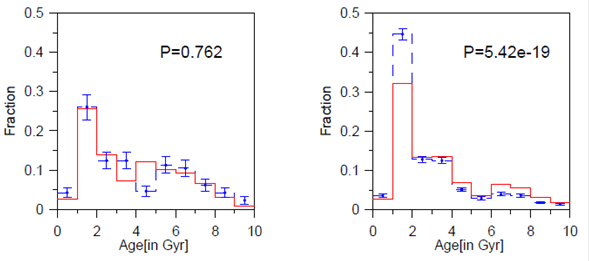
Fig. 1 Age distribution at both extremes of density for the faint (left panel) and luminous (right panel) volume-limited active galaxy samples: red solid line for the subsample at high density, blue dashed line for the subsample at low density. The error bars of the blue lines are 1 σ Poissonian errors, those of the red lines are omitted for clarity. The color figure can be viewed online.
C. The composite galaxies. They are the objects with S/N > 3 in all four BPT lines that are between the upper and lower lines in Figure 1 of Brinchmann et al. (2004). The upper line has been taken from equation (5) of Kewley et al. (2001).
AGN. The AGN population consists of the galaxies above the upper line in Figure 1 of Brinchmann et al. (2004). This line corresponds to the theoretical upper limit for pure starburst models.
Low S/N AGNs. They have [NII]6584/Hα > 0.6 (and S/N > 3 in both lines) (e.g. Kauffmann et al. 2003), and still are classified as an AGN even though their [O III]5007 and/or Hβ have too low S/N. Miller et al. (2003) called such AGNs the “two-line AGNs”.
Low S/N SF. The remaining galaxies with S/N > 2 in Hα are considered low S/N star formers.
Unclassifiable. Those remaining galaxies that are impossible to classify using the BPT diagram. This class is mostly made up of galaxies with no or very weak emission lines.
In the past, different authors often applied different AGN classification techniques. By requiring at least four greater than 3 σ-detected emission lines for each galaxy, Ivezić et al. (2002) actually set a higher threshold for separating AGNs from star-forming galaxies than that used by Miller et al. (2003), In the BPT diagram, the four lines (the [NII], [OIII], Hα , and Hβ emission lines) often are required to have signal-to-noise ratio S/N > 3. Miller et al. (2003) called such AGNs the “four-line AGNs”. Carter et al. (2001) and Miller et al. (2003) also identified galaxies with either a high [NII]/Hα or a high [OIII]/H𝛽 line ratio as AGNs, regardless of the other line ratio. Such AGNs are called the “two-line AGNs” as they are classified using only two lines. The “two-line AGNs” criterion of Miller et al. (2003) is slightly different from the one of Carter et al. (2001). Miller et al. (2003) used log ([NII]/Hα) > -0.2, while Carter et al. (2001) required log ([NII]/Hα) >-0.25. Deng et al. (2012) used the empirical demarcation line between star-forming galaxies and AGNs developed by Kauffmann et al. (2003). In this work, composite galaxies (C) are objects that are located between the upper and lower lines in the BPT diagram of Brinchmann et al. (2004). The lower line is taken from equation (1) of Kauffmann et al. (2003), while the upper line is equation (5) in Kewley et al. (2001). The AGN population consists of the galaxies above the upper line in the BPT diagram of Brinchmann et al. (2004). So AGN samples of Deng et al. (2012) actually contain C and AGN populations in this work. AGN samples of Deng et al. (2012) only contain the “four-line AGNs”, while in the AGN sample of Miller et al. (2003), the most frequent AGNs are the “two-line AGNs”.
In this work, we select C, AGN and Low S/N AGN populations and construct our AGN
sample which contains 122923 active galaxies. When constructing volume-limited
samples, we make use of the K-correction formula of Park et al. (2005):
The luminous volume-limited sample is constructed by selecting 39373 active galaxies
with the r-band absolute magnitudes
3.Environmental dependence of age of active galaxies
Like Deng (2010) did, we measure the local three-dimensional galaxy density (galaxies Mpc-3) which is defined as the number of galaxies (N=5) within the three-dimensional distance to the 5th nearest galaxy to the volume of the sphere with the radius of this distance. For each sample, we arrange galaxies in a density order from the smallest to the largest, select approximately 5% of the galaxies, construct two subsamples at both extremes of the density, and compare the distribution of age in the lowest density regime with that in the densest regime.
Figure 1 shows the age distribution at both extremes of density for the faint (left panel) and luminous (right panel) volume-limited active galaxy samples. As shown by this figure, in the luminous volume-limited sample, the age of active galaxies apparently depends on local environments: at low density the fraction of young galaxies with age less than 2 Gyr is significantly higher than the one in the high density case; at high density the fraction of old galaxies is significantly higher than the one at low density, although the prevalence of young galaxies with respect to old ones is higher in both the low- and high-density subsample. But in the faint volume-limited sample, the environmental dependence of the age of active galaxies is fairly weak. The decreasing trends as a function of age are similar regardless of density and luminosity range, even if the differences between low and high density are significant only for the high luminosity range.
We further perform the Kolmogorov-Smirnov (KS) test which can show the degree of similarity or difference between two independent distributions in a figure by calculating a probability value. A large probability implies that it is very likely that the two distributions are derived from the same parent distribution. Conversely, a lower probability value indicates that the two distributions are less likely to be similar. The probability of the two distributions coming from the same parent distribution is listed at the right upper corner of each figure. The K-S probability of the left panel in Figure 1 is much larger than 0.05 (5% is the standard in a statistical analysis), while the K-S probability of the right panel in Figure 1 is very small. This is in good agreement with the conclusion obtained by the step figures.
The luminosity and redshift ranges of the faint volume-limited active galaxy sample in this work are the same as ones of the faint volume-limited Main Galaxy sample used by Deng (2014). But Deng (2014) still observed strong environmental dependence of the age in the faint volume-limited Main Galaxy sample. Zheng et al. (2017) presented the stellar age and metallicity distributions for 1105 galaxies of the SDSS-IV MaNGA (Mapping Nearby Galaxies at APO) (Bundy et al. 2015) integral field spectra, studied the environmental dependence of age and metallicity values at the effective radii, and found that the age and metallicity values are dependent on the local density. Low-mass galaxies tend to be younger and have lower metallicity in low-density environments, while high-mass galaxies are less affected by the environment. The above-mentioned results show that the environmental dependence of the age of active galaxies is likely different from the one of genenal galaxies, which merits further studies.
Deng et al. (2009) demonstrated that the
galaxy luminosity strongly depends on the local environments only for galaxies above
the value of
4. Dependence of the clustering properties of active galaxies on age
The cluster analysis (Einasto et al. 1984) is a simple and straightforward method of studying the distribution of galaxies. § 4 of Einasto et al. (1984) describes this method in detail. The key step of this method is how to select a neighbourhood radius r for identifying various systems of objects. Finally, the galaxy sample is separated into galaxy systems of different size and density contrast, such as isolated galaxies, galaxy pairs, galaxy groups or clusters, and superclusters. The cluster analysis often was used for studies of superclusters (e.g., Einasto et al. 1984, 1994, 2001; Wray et al. 2006) and for the compilation of catalogs of galaxy groups (e.g., Eke et al.,2004; Berlind et al. 2006).
The cluster analysis is suitable for volume-limited samples. To investigate the dependence of the clustering properties of active galaxies on age, like Deng et al. (2016) did, we divide each volume-limited active galaxy sample into two subsamples with different ages: young and old, and then compare the clustering properties of young active galaxies with those of old active galaxies. Table 1 lists some parameters of the subsamples. To decrease the statistical bias of this method, like Deng et al. (2016) did, we select the age thresholds in volume-limited samples to ensure that the number density of the two subsamples is nearly the same.
Table 1 Some parameters of two subsamples in each volume-limited active galaxy sample
| Sample | Subsamples | Galaxy number | Poisson radius R0(Mpc) |
| Luminous volume-limited | Young (age<2.5[in Gyr]) | 19740 | 8.760 |
| active galaxy sample | old (age≥2.5[in Gyr]) | 19633 | 8.776 |
| Faint volume-limited | Young (age<3.1[in Gyr]) | 2642 | 7.490 |
| active galaxy sample | old (age≥3.1[in Gyr]) | 2506 | 7.623 |
The Poisson radius is that of the sphere with unit population, and is defined as
The multiplicity functions giving the fraction of the galaxies in systems with membership between n and n+dn, can describe the distribution of galaxy systems of different size and density contrast in the galaxy sample, which depend on the neighbourhood radius of the cluster analysis. This function is often plotted as a histogram. Following Deng et al. (2016), we divide the whole interval from 1 to 𝑁 (the total number of galaxies in the sample ) into 7 subintervals: n =1;2 ≤ n < 5;5≤ n <20; 20≤ n <50; 50≤n<100,100 ≤ n <200; n ≥ 200, and show histograms of the multiplicity functions from dimensionless radii r = 0.5 to r =1.3, to follow the multiplicity functions in detail.
Figure 2 shows histograms of the multiplicity functions for young and old galaxies in the luminous volume-limited active galaxy sample for dimensionless radii of r =0.5 to r =1.3. As can be seen from Figure 2, at all scales, young active galaxies have a higher prevalence than old ones at small multiplicity, corresponding to isolated galaxies, close pairs and small groups, whereas old active galaxies have a higher prevalence in the multiplicity bins corresponding to dense groups and clusters. This further confirms the clustering-age dependence of galaxies. When exploring this subject, previous works often focused on the cluster/field comparisons. However, the selection of the linking length for defining the cluster is often somewhat arbitrary. This work investigates the difference of clustering properties between young galaxies and old galaxies at all scales, thereby avoiding the ambiguity related to the definition of cluster.
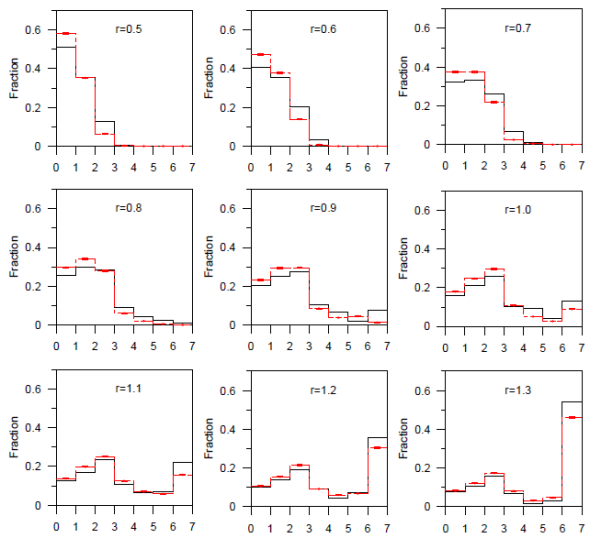
Fig. 2 Histograms of the multiplicity functions for old (black solid line) and young (red dashed line) galaxies in the luminous volume-limited active galaxy sample for dimensionless radii ranging from r=0.5 to r=1.3. The error bars in the red dashed histograms are 1 σ Poissonian errors. The error bars in the black solid histograms are omitted for clarity. The color figure can be viewed online.
Gao et al. (2005) explored the dependence of the clustering of haloes on halo age in ΛCDM simulations, and showed that older haloes are more strongly clustered than younger haloes. One possible explanation is that haloes of a given mass generally form earlier within denser regions (Reed et al. 2007). Thus, older haloes tend to populate denser regions, which naturally leads to stronger clustering with halo age. Reed et al. (2007) demonstrated that in mock galaxy catalogs, older mock galaxies are significantly more clustered, and suggested that the clustering-age dependence is manifest in real galaxies. Indeed, Proctor et al. (2004) and Mendes de Oliveira et al. (2005) observed that the member galaxies of compact groups are generally older than field galaxies. Such a clustering-age dependence of galaxies is also in good agreement with the above-mentioned environmental dependence of galaxy age (e.g., Bernardi et al. 1998; Trager et al. 2000; Kuntschner et al. 2002; Terlevich & Forbes 2002; Proctor et al. 2004; Mendes de Oliveira et al. 2005; Thomas et al. 2005; Gallazzi et al. 2006; Sánchez-Blázquez et al. 2006; Siĺchenko 2006; Rakos et al. 2007; Reed et al. 2007; Wegner & Grogin 2008; Smith et al. 2012; Deng 2014).
Figure 3 shows histograms of the multiplicity functions for young and old galaxies in the faint volume-limited active galaxy sample for dimensionless radii from r =0.5 to r =1.3. A substantial dependence of the clustering properties on galaxy age is observed in the faint volume-limited active galaxy sample, while as indicated above, the environmental dependence of the age of active galaxies in the faint volume-limited active galaxy sample is fairly weak. One possible explanation is that the galaxy number of the faint volume-limited active galaxy sample is too small to allow an ideal statistical analysis. Conclusions are affected by sampling fluctuations that are difficult to quantify.
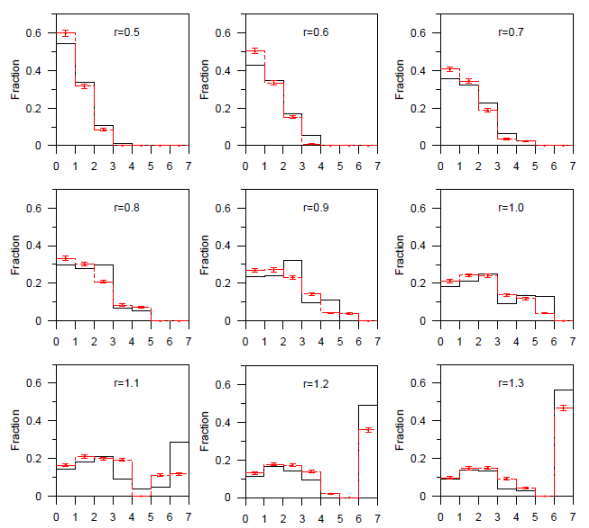
Fig. 3. Similar to Figure 2. Shown are histograms of the multiplicity functions for old (black solid line) and young (red dashed line) galaxies in the faint volume-limited active galaxy sample for dimensionless radii ranging from r = 0.5 to r = 1.3. The color figure can be viewed online.
5. Summary
From the Main Galaxy data of SDSS DR12, we use the BPT classification in the
galSpecExtra table, and select C, AGN and Low S/N AGN populations, which contain a
total of 122923 active galaxies. Considering that statistical conclusions may be
quite different between galaxies above and below the value of
An alternative approach is to examine the dependence of the clustering properties of active galaxies on age by cluster analysis. We divide each volume-limited active galaxy sample into two subsamples (young and old) with nearly same number density and then perform comparisons between them. The multiplicity functions in the dimensionless radii range from r= 0.5 to r =1.3 are analyzed, enabling the clustering properties to be explored on all relevant scales. Figure 2 shows histograms of the multiplicity functions for young and old galaxies in the luminous volume-limited active galaxy sample for dimensionless radii of r =0.5 to r =1.3. As can be seen from Figure 2, at all scales, young active galaxies have a higher prevalence than old ones at small multiplicity, corresponding to isolated galaxies, close pairs and small groups, whereas old active galaxies have a higher prevalence in the multiplicity bins corresponding to dense groups and clusters. A substantial dependence of the clustering properties on galaxy age is also observed in the faint volume-limited active galaxy sample, which is inconsistent with the environmental dependence of the age of active galaxies in the faint volume-limited active galaxy sample. One possible explanation is that the number of galaxies in the faint volume-limited active galaxy sample is too small to allow an ideal statistical analysis. Conclusions are affected by sampling fluctuations that are difficult to quantify.

