


 texto en
  Inglés (pdf)
 Artículo en XML
 Referencias del artículo
 Enviar artículo por email
 Citado por SciELO
  Similares en
SciELO
Similares en
SciELO 
 Permalink
Introduction
Species of the family Magnoliaceae are considered primitive because their sepals and petals are not clearly differentiated, and because their flower parts are arranged in spirals rather than rings as in most other angiosperms (Cicuzza, Newton, & Oldfield, 2007). This feature is of great interest in evolutionary, biogeographical, taxonomic and ecological studies (Endress & Doyle, 2009). Magnolia mexicana DC. is a species endemic to Mexico that is found in high tropical evergreen and tropical montane cloud forest (TMCF) (Palacios, 2006). The habitat of the species is seriously threatened; approximately 50 % of the original TMCF area has been replaced by other types of cover (Comisión Nacional para el Conocimiento y Uso de la Biodiversidad [CONABIO], 2010). This situation is related to climate change and anthropogenic activities such as road construction, shepherding and hunting (CONABIO, 2010; Nora, Albaladejo, González-Martínez, Robledo-Arnuncio, & Aparicio, 2011). For this reason, M. mexicana was included in the NOM-059-SEMARNAT-2010 list of threatened species (Secretaría de Medio Ambiente y Recursos Naturales [SEMARNAT], 2010). Currently, there are viable populations in the states of Chiapas, Oaxaca, Veracruz and Puebla; some are remnants associated with crops, mainly in coffee plantations, where they are used as shade (Palacios, 2006).
In threatened plant species such as M. mexicana, it is important to know the population’s genetic structure, levels of variation and genetic differentiation, as well as the effects of microevolutionary mechanisms. Natural selection, inbreeding, genetic drift, mutation, and gene flow are influenced by the population’s demographic dynamics, caused by birth, mortality, and migration rates (Hamrick, Godt, & Sherman-Broyles, 1992). Although M. mexicana is a species endemic to our country, to date there are no studies on the existing genetic diversity. Levels of genetic variation between organisms of a species or between different taxonomic levels can be determined through traditional methods of morphological comparisons and modern DNA analysis techniques (Mohammadi & Prasanna, 2003). Inter-Simple Sequence Repeats (ISSRs) are a type of genetic marker that allows measuring the levels of variation in the intermicrosatellite regions dispersed in the genome. ISSRs are semi-arbitrary markers, so they are amplified from a primer complementary to the microsatellite region (Cornejo, Serrato, Rendón, & Rocha, 2014). These markers have been used in species such as sorghum and banana (Godwin, Aitken, & Smith, 1997), coffee tree (Aga, Bekele, & Bryngelsson, 2005) and primitive cataloged plants such as cycads (Xiao, Ge, Gong, Hao, & Zheng, 2004). The aim of this study was to evaluate the genetic variability present in two populations of M. mexicana through the use of ISSR molecular markers. The populations belong to the regions of Amatitla and Zapotla in the municipality of Zongolica, Veracruz, Mexico.
Materials and methods
Plant material
Due to technical difficulties related to the collection of young leaves of M. mexicana in average-height trees of 35 m and in order to obtain good quality DNA, it was decided to evaluate plant material provided by the environmental management unit of Yoloxóchitl, located in the municipality of Zongolica, Veracruz, Mexico. Seeds from Amatitla (18° 39´ 34.77” N, 96° 59´ 43.38” W) and Zapotla (18° 38´ 46.72” N, 96° 58´ 20.61” W), localities located at a distance of 2 248 m from one another, were collected and germinated in situ. Subsequently, six and seven specimens corresponding to each locality were used to obtain the young leaves and carry out the DNA extraction.
Extraction and purification of genomic DNA
DNA extraction was done according to the method reported by Dellaporta, Wood, and Hicks (1983). For this purpose, 0.3 g of plant material were weighed and suspended in a solution (pH 8.0) of Tris-HCl (100 mM), EDTA-Na2 (50 mM), NaCl (500 mM), 2-Mercaptoethanol and SDS (1.3 %), as extraction buffer. Subsequently, the solution was centrifuged at 12 000 rpm for 20 min. The supernatant was mixed with cold isopropanol and the DNA was allowed to precipitate for 60 min, then STE solution (Tris-HCl [50 mM], EDTA-Na2 [10 mM], NaCl [100 mM], pH 8.0) and RNase (10 mg·mL-1) were added and the mixture was incubated at 37 °C for one hour. Sodium acetate (3 M) and cold isopropanol were then added and the mixture was centrifuged at 8 000 rpm for 5 min for DNA precipitation and supernatant removal. The DNA was washed with ethanol (70 %) and allowed to dry, then dissolved in TE buffer (Tris-HCl [10 mM], EDTA-Na2 [1 mM], pH 8.0) and stored under refrigeration until use. The amount and purity of the DNA was measured on a Thermo Scientific® NanoDrop (LITE model, USA) and the quality was determined by electrophoresis in agarose stained with ethidium bromide. Bands were visualized under ultraviolet light on a DigiDoc-it Imaging System transilluminator (UVP®, USA) and the images obtained were documented using a Kodak® EDAS290 camera.
Obtaining ISSR-PCR patterns
A total of 55 ISSR primers (Sigma®) were tested and the 10 that produced the highest number of clear bands with polymorphism were selected (Table 1). The DNA segments were amplified by PCR. The mixture for PCR had a total volume of 25 μL, including the following reagents: 5.2 μL of molecular biology-grade H2O, 10 μL of dNTPs (dGTP, dATP, dTTP, dCTP at a concentration of 500 μM), 2.5 μL of PCR buffer (10X), 1.5 μL of MgCl2 (50 mM), 3.0 μL of primer (10 ng·μL-1), 0.3 μL of Taq DNA polymerase (5 U·µL-1) and 2.5 μL of genomic DNA from samples homogenized at a concentration of 10 ng·µL-1. The mixture was subjected to an initial denaturation cycle of 8 min at 93 °C, followed by: 40 cycles of 1 min at 93 °C, 1 min at the recommended annealing temperature for each primer (Table 1), 1 min at 72 °C, and a final extension cycle of 6 min at 72 °C. The amplification was performed in a Techne® TC-412 model thermocycler (USA). Separation of the amplified products was done by electrophoresis on 1 % agarose gel with TAE buffer (Tris acetate [40 mM], pH 7.6, Na2EDTA [1 mM]), stained with ethidium bromide to visualize bands in ultraviolet light on the DigiDoc-it Imaging System transilluminator (UVP®). The images obtained were documented with the Kodak® EDAS290 camera.
Table 1 ISSR primers used in two populations of Magnolia mexicana in the Zongolica region, Veracruz.
| Primer | Sequence (5´-3´) | At (°C) | TB | PB | P (%) |
|---|---|---|---|---|---|
| ISSR2 | (CA)8AAGCT | 62 | 10 | 10 | 100 |
| ISSR3 | (GA)8CTC | 58 | 9 | 5 | 55.5 |
| ISSR4 | (AG)8CTG | 58 | 9 | 9 | 100 |
| LOL9 | (CAC)3GC | 38 | 10 | 9 | 90.0 |
| MESL3 | (TG)7G | 46 | 6 | 6 | 100 |
| PI02 | (CA)6AGG | 46 | 5 | 5 | 100 |
| PI04 | (CT)8AGC | 58 | 10 | 8 | 80.0 |
| UBC840 | (GA)8CTT | 56 | 5 | 4 | 80.0 |
| UBC842 | (GA)8CTG | 58 | 8 | 5 | 62.5 |
| 17898B | (CA)6GT | 42 | 9 | 9 | 100 |
| 81 | 70 | 86.4 |
At: Annealing temperature, TB: total bands, PB: polymorphic bands, P: polymorphism.
Statistical analysis
The number of bands, product of the amplification, was quantified by assigning the value 1 to the presence and 0 to the absence thereof; in this way, a basic data matrix (BDM) was constructed to perform the analyses. Genetic similarities were obtained with the Jaccard coefficient with √1-S transformation and cluster analysis was performed using Ward's minimum variance method; in addition, the analysis of molecular variance (AMOVA) was conducted to quantify the distribution of molecular variability within and between populations (Balzarini, Bruno, Peña, Teich, & Di Rienzo, 2010), and finally the Shannon-Weaver diversity index was calculated.
To obtain a spatial representation of the distribution of the M. Mexicana samples, a Principal Coordinates Analysis (PCoA) was performed along with a Shortest-Path Tree (SPT), which is a geometric representation of the results from the cluster analysis. This analysis is suggested to improve the interpretation by also considering the deformations that occurred in the projection of the principal coordinates (Balzarini et al., 2010). All analyses were done with Info-Gen® software (Balzarini & Di Rienzo, 2004).
Results and discussion
One of the objectives of the analysis with molecular markers is the classification of individuals so that homogeneous groups can be distinguished among them. For this purpose, hierarchical cluster analysis methods are used (Balzarini et al., 2010). Figure 1 shows the dendrogram obtained for the M. mexicana samples, which mainly reflected the geographical origin of the materials. In this figure, at a cutting height of 0.83, two groups can be clearly distinguished: group one consisting of five of the seven specimens from Zapotla, while group two was composed of five of the six specimens from Amatitla. These results show that the genetic differentiation between populations was sufficient to change the frequency of ISSR bands allowing their clear separation. However, band patterns do not necessarily reflect the variation pattern in genes controlling important agronomic or geographic suitability traits, so ISSR markers do not always discriminate genotypes based on area of adaptation. The differences between these three individuals could be due to gene flow between the two populations or due to the presence of similar evolutionary factors (Slavov et al., 2013).
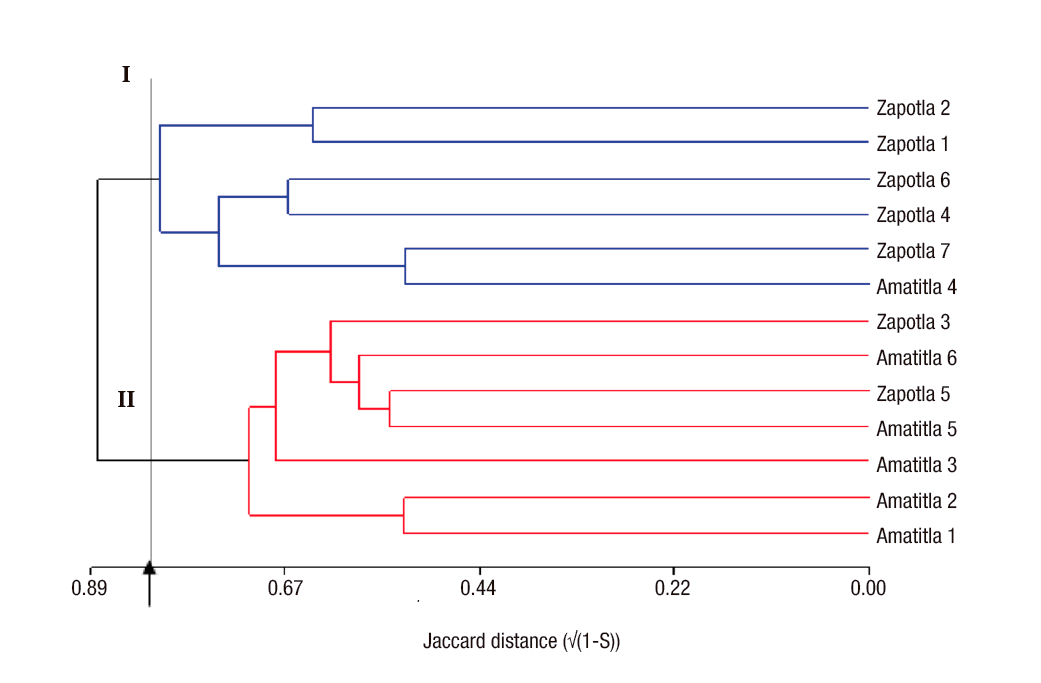
Figure 1 Dendrogram constructed by Ward's minimum variance method and Jaccard distances between samples of Magnolia mexicana from Zongolica, Veracruz, Mexico.
The PCoA analysis, in Figure 2, shows that all elements from Amatitla can be enclosed within a circle due to their proximity, while the Zapotla specimens are located outside this group. The same tendency is observed in the SPT (Figure 2), in which the elements closest to each other, corresponding to the Amatitla trees, are connected by lines. The analyses of PCoA and SPT clusters reflected the distribution of the specimens according to the collection area (Amatitla and Zapotla), while in the dendrogram some specimens were poorly grouped.
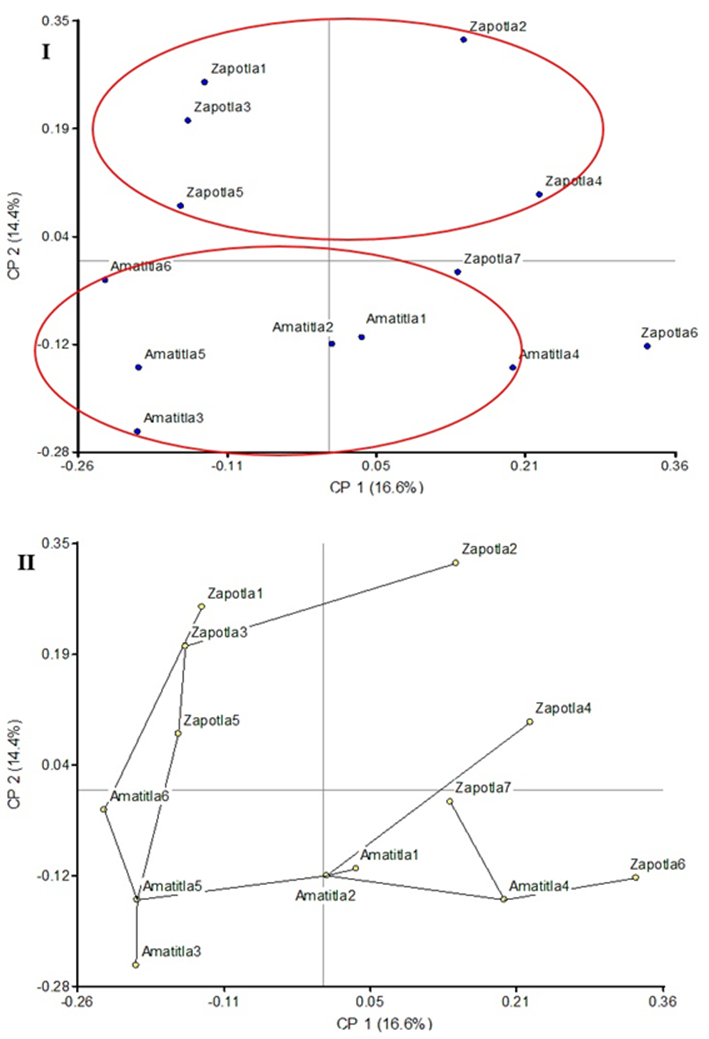
Figure 2 Principal Coordinates Analysis (I) and Shortest-Path Tree (II) of 13 samples of Magnolia mexicana from Zongolica, Veracruz, Mexico.
The use of ISSR markers is a technique that allows detecting high polymorphic variation in a DNA sequence (Cornejo et al., 2014). These markers have been used successfully to distinguish the genetic variation, structure and differentiation of different tree species, among them: Dendropanax arboreus (L.) Decne. & Planch. in the area of Los Tuxtlas, Mexico (Figueroa-Esquivel, Puebla-Olivares, Eguiarte, & Núñez-Farfán, 2010); Theobroma speciosum Willd. ex Spreng. in Brazil (Giustina et al., 2014); Swietenia macrophylla King in Costa Rica (Céspedes, Gutiérrez, Holbrook, & Rocha, 2003); and S. humilis Zucc. in Central America (White, Boshier, & Powell, 1999).
Fragmentation is a process involving the alteration of the quality and size of a habitat that leads to a loss of biodiversity at intraspecific level, which causes genetic drift and inbreeding and, therefore, reduced genetic variability (Nora et al. 2011). In the present study, the AMOVA analysis showed that 90.88 % of the genetic variation is attributable to individual differences within the two sampled populations (Table 2), so the effect of fragmentation is not evident at this level. In other studies using ISSRs, high genetic variability has been reported within populations of Magnolia wufengensis L. (90.9 %) (Chen, Chen, He, & Ma, 2014) and M. officinalis Rehder & E. H. (68.4 %) (Yu, Yang, Sun, & Liu, 2011), both studies conducted in China. Thus, the AMOVA results in the present study coincide with the general observation that woody, perennial, and exogenous species retain most of their variation within populations (Hamrick et al., 1992).
Table 2 Analysis of molecular variance (AMOVA) of two populations of Magnolia mexicana from Zongolica, Veracruz.
| Source of variation | Sum of squares | Degrees of freedom | Mean squares | P-value | Components of variance | Variation (%) |
|---|---|---|---|---|---|---|
| Between populations | 20.81 | 1 | 20.81 | 0.0300 | 1.27 | 9.12 |
| Within a population | 138.88 | 11 | 12.63 | 0.0175 | 12.63 | 90.88 |
| Total | 159.69 | 12 | 13.31 | 13.89 | 100.00 |
Calculating the Shannon-Weaver diversity index allows dimensioning the genetic diversity, considering a value of zero when only one allele is present in the population; as the number of alleles increases, the value also increases and thus the genetic diversity (Pla, 2006). Table 3 shows the calculated diversity indexes for the sampled M. mexicana populations, which were very similar (0.47 and 0.41 for Amatitla and Zapotla, respectively). Balzarini et al. (2010) consider that samples from two populations will always have a value greater than the mean of their diversities determined separately, except if both populations are identical in composition. In this study, the mean value of the diversity index was 0.44, while the total diversity was 0.42, indicating that the sampled populations have equal genetic diversity. The values of the Shannon-Weaver index were similar to those estimated in other species of the genus Magnolia. Yu et al. (2011) reported a diversity value of 0.41 in populations of Magnolia officinalis (Rehder & E. H. Wilson) sampled in China, whereas Newton et al. (2008) determined an index of 0.56 in collections of Magnolia sharpii Miranda and 0.50 in Magnolia schiedeana Schltdl., in Mexico.
Table 3 Shannon-Weaver diversity index in two populations of Magnolia mexicana from Zongolica, Veracruz.
| Group | n | I | LL | UL | IBoot | SEBoot |
|---|---|---|---|---|---|---|
| Amatitla | 6 | 0.47 | 0.39 | 0.41 | 0.40 | 0.03 |
| Zapotla | 7 | 0.41 | 0.40 | 0.41 | 0.40 | 0.03 |
| Total | 2 | 0.42 | 0.41 | 0.42 | 0.42 | 0.03 |
n: number of samples, I: Shannon-Weaver diversity index, LL: lower limit, UL: upper limit, Iboot: 500 bootstrap cycles with a 95 % confidence interval, SEBoot: bootstrap standard error.
The degree of genetic differentiation usually increases when the distance between populations increases (Pusadee, Jamjod, Chiang, Rerkasem, & Schaal, 2009). However, Yu et al. (2011) assert that other factors have contributed to maximizing the genetic variability of M. officinalis, such as those related to its ornamental characteristics, human intrusion due to displacement by settlers and birds attracted by the high visibility of the species’ red seeds. In M. mexicana it has been found that beetles of the genus Cyclocephala act as pollinating and dispersing agents in the Zongolica area (Mora-Aguilar & Delgado, 2012). Some studies have shown that pollen immigration rates can be high in fragmented populations, especially if pollination is entomophilic, estimating distances from 21 m in Centaurea corymbosa Pourr. (Hardy et al., 2004) to 88.6 km in Ficus sycomorus L. (Ahmed, Compton, Butlin, & Gilmartin, 2009).
On the other hand, it should be noted that high tropical evergreen and tropical montane cloud forests in areas of Veracruz, such as Zongolica and Los Tuxtlas, have relics of conserved areas (Sandoval et al., 2007). The results obtained in the present study suggest that the reduced habitat and decreased populations of M. mexicana have not yet reduced the genetic variability of the natural populations in an important way. However, it is necessary to carry out studies in other populations of M. mexicana considering a greater number of localities, to have a more accurate estimate of the changes in the genetic structure and variation of the species in the state of Veracruz, in particular, and of Mexico, in general.
Conclusions
The results of this study suggest that the Magnolia mexicana populations have not undergone changes that modify their genetic structure, so there is no evidence, at genetic level, of alterations caused by the population reduction or habitat fragmentation. The levels of genetic diversity of M. mexicana in the studied populations are similar to those reported in other species of the family Magnoliaceae, as well as in other trees in tropical montane cloud forests. ISSR molecular markers proved their usefulness in evaluating the genetic variability present in arboreal species such as M. mexicana.

