


 nueva página del texto (beta)
 Inglés (pdf)
 Artículo en XML
 Referencias del artículo
 Enviar artículo por email
 Citado por SciELO
  Similares en
SciELO
Similares en
SciELO 
 Permalink
Introduction
Credited as mesenchymal stem cells (MSCs), dental pulp stem cells (DPSCs) have gained a great relevance due their easy accessibility without ethical controversies. DPSCs exhibit self-renewal capacity and express multiple MSC markers and pluripotency-related genes [1]. In addition, under basal conditions, DPSCs express osteogenic, adipogenic, myogenic and neural markers, making this cell population a good candidate for therapeutic applications [2-4]. Unfortunately, similar to other MSCs, DPSCs retain part of their cellular identity, which is essential for maintaining the normal function of the tissue from which they are derived. That means that whereas some MSCs can be easily induced to a specific lineage, cellular identity represents a substantial impediment to converting these cells into other relevant cell types. In this regard, adipogenesis, the process of conversion of MSCs to mature adipocytes, represents a good example of this.
Recent studies indicate that regardless of the model system, the transcriptome of MSCs is more similar to that of osteoblasts than that of adipocytes, which might favour mineralization events over adipogenesis [5,6]. This suggests that adipogenic differentiation requires more drastic transcriptional changes than osteogenesis. In line with these findings, quantitative results have shown that whereas DPSCs exhibit a higher osteogenic potential, they display a limited adipogenic capacity when compared to human bone marrow stem cells (BMSCs) and even to other dental stem cells, including dental follicle stem cells (DFSCs) or periodontal ligament stem cells (PLSCs) [7,8]. Such cell fate decisions are modulated through epigenetic mechanisms including modification of chromatin or DNA, that result in heritable patterns of tissue-specific gene expression.
For instance, key adipogenic factors such as peroxisome proliferator-activated receptor-γ (PPARγ) [9] and CCAAT/enhancer-binding protein (C/EBPα), which are required to drive the adipogenic program that leads to the mature adipocytes, might be affected by wingless-type member 10B (WNT10B) or Msh-2-like homeobox, which avoid the expression of PPARγ and C/EBPα to promote osteogenesis in DPSCs [10]. In addition, the hypo- and hypermethylated loci of WNT10B and PPARγ in DPSCs [11], support the idea that DNA methylation inhibits the binding of transcription factors to DNA to prevent the adipogenic commitment.
On the other hand, DNA methylation can be reversed by TEN ELEVEN TRANSLOCATION (TET) family enzymes. A study showed that Tet2 led to the enrichment of 5-hydroxymethylcytosine (5hmC) at the Pparγ locus to manage its transcription during 3T3-L1 adipogenesis [12,13]. In contrast, another study suggested that Tet2 should be considered an antiadipogenic demethylase, since its knockdown (KD) increases Pparγ and Cebpa expression in 3T3-L1 cells [14]. However, we do not discard that the culture methods, the heterogeneity of supplements for adipogenic induction, and the variability between cell lines can affect the reproducibility of the results. In human BMSCs, KD of TET2 affects osteogenesis but not adipogenic differentiation [15,16]. We previously reported that TET2 is preferentially expressed in DPSCs, but not in PLSCs under adipogenic induction [11]. This finding and given that the role of TET2 has been controversial, encouraged us to investigate whether the functional gain of TET2 by overexpression may have a crucial role in the adipogenesis of DPSCs. Our results demonstrated that overexpression of TET2 upregulated the expression of PPARγ, ADIPOQ, FABP4, and LPL, which in turn improved the adipogenic commitment of DPSCs.
Experimental
Materials and methods
Isolation and cell culture
Briefly, dental pulp tissues were obtained from third molars with previously informed consent letters from female patients aged 14 and 24 years. Dental pulp tissues were cultured through the outgrowth method as previously described [8]. Dental cells were cultured in α-MEM containing 10 % fetal bovine serum (FBS, Gibco, USA) and 1 % (penicillin/streptomycin, Gibco) and incubated at 37 (C with 5 % CO2. The medium culture was replaced twice a week. At approximately 80 % confluence, the cells were collected with 0.25 % trypsin-EDTA (Gibco, USA) and subcultured in a T-25 flask. The use of extracted teeth in the present study was approved by the ethics Research Committee of Dr. Hideyo Noguchi, Regional Research Center, Universidad Autónoma de Yucatán (No. CIE-06-2017). Cells at passages 4-8 were used for the experiments.
Plate cloning
Colony-forming assays were plated at a density of 200 cells/dish (35-mm diameter) and cultured in α-MEM medium supplemented with 10 % FBS for 14 d under standard culture conditions. All cell cultures were fixed for 10 min with 2 mL of 4 % paraformaldehyde (PFA, Sigma-Aldrich, USA) and stained with 0.05 % crystal violet (Sigma-Aldrich, USA). The cells were washed twice with distilled water, and the number of colonies was counted. Fifty or more clustered cells were considered as colonies.
Flow cytometric analysis
Cells at passage 4 were trypsinized, washed with 1X PBS and resuspended at a density of 1 x 10⁶ cells in flow staining buffer (BD Biosciences). Briefly, 100 µl of cells were incubated with primary antibodies against CD34, CD45 (Biolegend), CD90 and CD105 (Abcam) for at least 30 min at 4 ºC. After two washes in PBS, the cells were incubated with Alexa Fluor 488 (Thermo Fisher) for 30 min in the dark at 4 °C and washed twice with flow staining buffer. A total of 100,000 events were acquired and analyzed in a FACSVerse cytometer and analyzed in FlowJo vX.o.7 (BD Biosciences).
In vitro differentiation assays
DPSCs were seeded at a density of 3 x 10⁴ cells/well in a 12-well plate and cultured for 24 h in α-MEM supplemented with 10 % FBS and 1 % (penicillin/streptomycin) before osteogenesis, chondrogenesis or adipogenesis induction. Osteoblast and chondrogenesis differentiation were induced for two weeks as described by Gopinathan et al. [17] and according to the instructions of the StemPro chondrogenesis kit (GIBCO), respectively.
The adipogenesis induction medium (AIM) consisted of α-MEM supplemented with 10 % FBS, 1 % antibiotic/antimycotic, dexamethasone (1 μM), IBMX (500 μM), indomethacin (60 μM), insulin (1.72 μM), rosiglitazone (5 μM), biotin (33 μM), pantothenic acid (17 μM) and HEPES (15 mM) (all purchased from Sigma-Aldrich). Cells were cultured and induced toward adipogenesis for 21 days. After osteogenic, chondrogenic or adipogenic differentiation, the cells were fixed in 4 % PFA, rinsed twice with 1X PBS and stained with 2 % Alizarin Red S for calcium deposition, 1 % Alizarin Blue Black for chondrocytes and with 0.1 % Oil Red O for lipid droplets (Sigma-Aldrich, USA). Cells cultured in basal medium without differentiation factors were used as controls.
Cell culture and plasmid transfection
The plasmid encoding TET2 was obtained from Horizon discovery (MHS6278-202800300). Briefly, 2 x 10⁴ cells/well were seeded in 12-well plates before transfection. When the cells reached 70-80 % confluence, they were transfected with 0.5 μg DNA using Lipofectamine 3000 according to the manufacturer’s instructions. At 48 h posttransfection, the cells were cultured in AIM for 21 days and harvested for further analysis.
Total RNA extraction and gene expression analysis by reverse transcription PCR (RT-PCR) and quantitative PCR
Total RNA from DPSCs and transfected DPSCs was isolated using a Direct-zol RNA kit (Zymo Research) according to the manufacturer’s instructions. For cDNA synthesis, reverse transcription reactions were performed with 1 µg RNA by using the SuperScript First-Strand Synthesis System (Invitrogen) following the manufacturer’s instructions. RT-PCR was performed to measure the levels of pluripotency-associated gene expression (NANOG, OCT4, KLF4, c-MYC, and SOX2) and DNA demethylase TET2. MyTaqTM DNA Polymerase (Bioline, UK), 1 μM of each primer, and 100 ng/μL of cDNA in a 25 μL volume was used during PCR by using a C1000 Touch Thermal cycler (BIO-RAD, USA). The PCR products were electrophoresed in a 1.5 % agarose gel and stained with ethidium bromide (Sigma-Aldrich, USA). Images were acquired using the Gel Doc Xr+ System Glyceraldehyde 3-phosphate dehydrogenase (GAPDH) was used as an internal control. qRT-PCR was performed in triplicate using iTaq Universal SYBR Green Supermix (BIO-RAD) in an Eco Real-time PCR System and analyzed using EcoStudy Software. Changes in gene expression were calculated relative to 18S rRNA using the 2-((CT method [18]. The primers used for RT-PCR and qPCR are listed in Table 1.
Table 1 Primer sequences for the genes evaluated in the current study.
| Gene | Primer forward Sequence (F-5´-3´) | Primer reverse Sequence (R-5´-3´) | Product size (pb) |
| 18S rRNA | GGACAGGATTGACAGATTGAT | AGTCTCGTTCGTTATCGGAAT | 111 |
| GAPDH | CTTTGGTATCGTGGAAGGACTC | GTAGAGGCAGGGATGATGTTCT | 132 |
| SOX2 | ACACCAA TCCCA TCCACACT | CCTCCCCAGGTTTTCTCTGT | 117 |
| KFL4 | TACCAAGAGCTCATGCCACC | CGCGTAATCACAAGTGTGGG | 111 |
| c-MYC | GGACCCGCTTCTCTGAAAGG | TAACGTTGAGGGGCATCGTC | 104 |
| NANOG | TGCTGAGATGCCTCACACGGA | TGACCGGGACCTTGTCTTCCTT | 117 |
| OCT4 | GAAAGGGACCGAGGAGTA | CCGAGTGTGGTTCTGTAAC | 196 |
| TET2 | ATTCTCGATTGTCTTCTCTAGTGAG | CATGTTTGGACTTCTGTGCTC | 99 |
| PPARɣ2 | CTCCTATTGACCCAGAAAGC | TCAAAGGAGTGGGAGTGGTC | 160 |
| LPL | TCATTCCCGGAGTAGCAGAGT | GGCCACAAGTTTTGGCACC | 125 |
| ADIPOQ | ATGGTCCTGTGATGCTTTGA | GTTGAGTGCGTATGTTATTTTT | 229 |
| FABP4 | AGCACCATAACCTTAGATGGGG | CGTGGAAGTGACGCCTTTCA | 183 |
Results and discussion
Dental pulp cells exhibit mesenchymal features
Dental pulp cells (DPCs) isolated from dental pulp tissue of healthy donors (female, 24 years) displayed typical fibroblast-like morphology after the first passages (Fig. 1(A)). Consistent with the criteria defined by the International Society for Cellular Therapy [19], primary culture of DPCs exhibited higher surface mesenchymal markers CD90 and CD105, whereas they lacked expression of hematopoietic-associated markers CD34 and CD45 (Fig. 1(B)). In addition, when cultured at low density, dental pulp cells were able to generate adherent colonies that exhibited self-renewal ability (Fig. 1(C)). In line with several studies [20, 21], DPCs also expressed stemness-related markers, including OCT4, NANOG, SOX2, KLF4 and c-MYC (Fig. 1(D)), indicative of their self-renewal potential and multipotent capacity [1]. To demonstrate this, DPCs were induced to undergo adipogenic, osteogenic, and chondrogenic differentiation (Fig 2). Mineralized nodule formation was determined by Alizarin Red staining after 14 days, showing that DPCs were able to form mineralized nodules, a characteristic of these cells to accumulate great calcium deposits [22,23]. Furthermore, DPCs successfully differentiate into cartilage cells after 14 days, as evidenced by black alizarin staining to detect extracellular matrix proteoglycans commonly found in cartilage tissues [24]. In addition, Oil Red O staining indicated the differentiation of DPCs into adipocytes, which became visible by intracellular accumulation of lipid droplets at 21 days after induction (dai). Taken together, these findings indicate that the dental cells evaluated here (Figures 1-2) display mesenchymal stem cell features; therefore, this cell population was termed DPSCs.
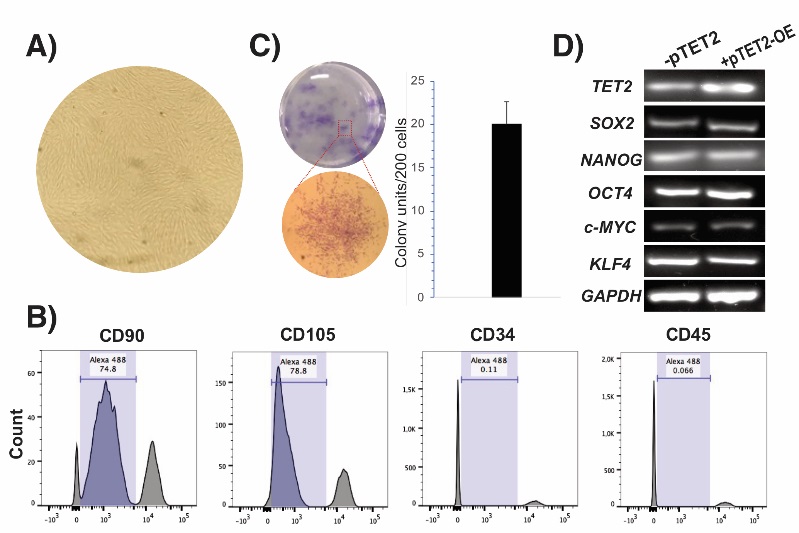
Fig. 1 Mesenchymal features of dental pulp cells (DPCs). (A) Typical fibroblast-like cells of DPCs at passage 4 (B) Representative histograms of DPCs showing the expression of mesenchymal stem cell markers and the lack of expression of hematopoietic markers determined by flow cytometry. (C) Unit-forming colony assay of DPSCs determined by crystal violet staining after 14 days of culture. Error bars represent the standard deviation of the mean from three independent experiments. (D) Expression profile of stemness-related genes in DPSCs overexpressing (+pTET2-OE) or not overexpressing (-pTET2) TET2.
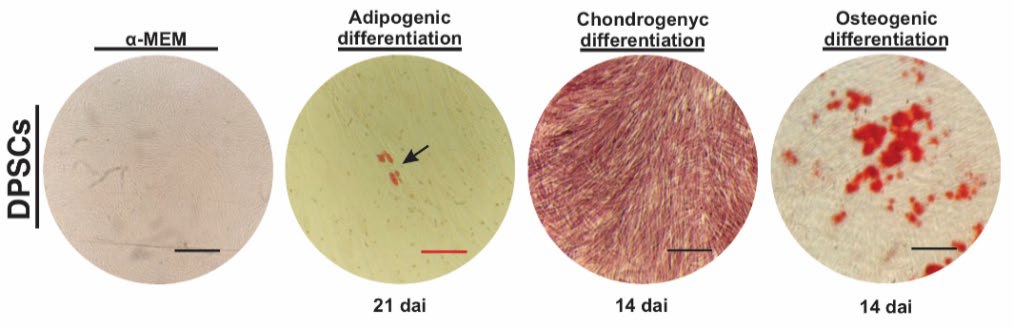
Fig. 2 Trilineage capacity of dental pulp stem cells (DPSCs). Phenotypical differentiation of DPSCs after adipogenic, chondrogenic and osteogenic induction treatments. Adipocytes, chondrocytes, and osteocytes were assessed by Oil red O, Alizarin Blue and Alizarin Red staining at 21 and 14 days after induction (dai), respectively. The black and red scale bars indicate 150 and 50 (m, respectively.
TET2 overexpression stimulates the adipogenic response of DPSCs
Although MSCs are the major source of adipocytes, adipogenesis is widely complex and can be differentially regulated among different depots from which they can emerge. In this regard, and independently of their mesenchymal features, it has been reported that DPSCs fail or possess a lower adipogenic capacity [8, 10, 25]. Although some studies have shown the presence of cells with lipid droplets or the expression of adipocyte markers, the tissue-specific epigenetic patterns that determine the differentiation potential of DPSCs are widely unknown. Our group has previously shown that both DNA (de) methylation-related genes are highly expressed in DPSCs under adipogenic conditions [11], and although TET2 is upregulated during adipogenic induction, it is not clear whether this DNA methylation eraser acts as an inductor or repressor of adipogenesis in DPSCs. Considering that TET family members are involved in regulating DNA methylation levels [13,26], a repressive epigenetic mark enriched at the PPAR( locus [11, 13, 14], we hypothesized that functional gain of TET2 could improve the DPSC adipogenic response.
To investigate the role of TET2 in adipogenesis, we overexpressed TET2 in DPSCs. Transfected cells (pTET2-OE) exhibited increased TET2 transcript levels 48 hr after treatment and induced slightly increased expression of SOX2 compared to the control cells (Fig. 1(D), Fig. S1). Furthermore, the gain functional assay showed that pTET2-OE cells exhibited a prompt response to adipogenic stimuli, since cells with lipid droplets were clearly visible under bright light microscopy at 9 dai. In contrast, DPSCs without plasmid (-pTET2 cells) generated adipocytes almost at the end of induction (Fig. 3(A)). Oil red O staining allowed us to visualize a substantial adipocyte number in pTET2-OE cells compared to the -pTET2 cells at 21 dai. Although the size of lipid droplets was larger in -pTET2 cells than in pTET2-OE cells, the latter presented multiple but small lipid droplets with respect to the -pTET2 cells (Fig. S2).
It has been reported that DPSCs possess a low adipogenic capacity [10] and that differentiation capability declines with the number of cellular passages [27]. The specific effect of functional gain of TET2 on adipogenesis was independently validated in a second line of uncharacterized DPSCs from passage 8 (DPCS-14 M, p8). Again, the forced expression of TET2 facilitated the generation of adipocytes in DPSCs-14M, suggesting that TET2 might be required to decrease the levels of DNA methylation, which in turn might promote the transcription of adipogenesis-related genes. In support of this finding, it has been reported that Tet2 promotes an enrichment of 5-hmC at the Ppar( locus to induce its expression, whereas its KD blocks adipogenesis in 3T3-L1 cells [12,13]. However, the role of TET2 in adipogenesis seems to be controversial and is thus far to be clarified, since another research group claims all contrary by considering that Tet2 acts as an antiadipogenic demethylase in 3T3-L1 cells [14]. In human cells, cumulative research suggests that TET2 has a preferential role in mineralization events because its loss of function affects osteogenesis but not adipogenic differentiation [15,16,28]. Additionally, another study indicated that TET2 can be recruited by TET1 to promoters of osteogenic-related genes in human BMSCs [16].
On the other hand, to examine whether a relationship exists between pTET2-OE cells and adipogenic capacity, we evaluated the expression of four well-known adipogenic markers, including PPAR(, ADIPOQ, FABP4, and LPL [29, 30]. The gain functional assay revealed that TET2 could demethylate the PPAR( locus, since it accelerates and improves the adipogenic capacity of DPSCs by enhancing PPAR( expression (Fig. 3), which is required for sustained expression of ADIPOQ, FABP4, and LPL [29]. For instance, we registered more than 4- and 2.5-fold PPAR( and ADIPOQ expression in TET2-OE cells compared to -pTET2 cells, respectively. In addition, a 30- and 50-fold expression of FABP4 and LPL, respectively, was also detected in pTET2-OE cells with respect to -pTET2 cells. These protein encoding genes (PPAR(, ADIPOQ, FABP4, and LPL) are involved in the beginning and final stages of adipogenic differentiation [29, 30] that allow the transition of precursor cells to mature adipocytes. This can synthetize and transport lipids, as well as produce ADIPOQ, an essential hormone for insulin sensitivity [31, 32]. Consistent with the described function of adipogenesis-related genes, it was evident that the molecular changes observed in pTET2-OE cells led to an increased ability of the cells to synthetize and store more lipids when compared to -pTET2 cells (Fig. 3).
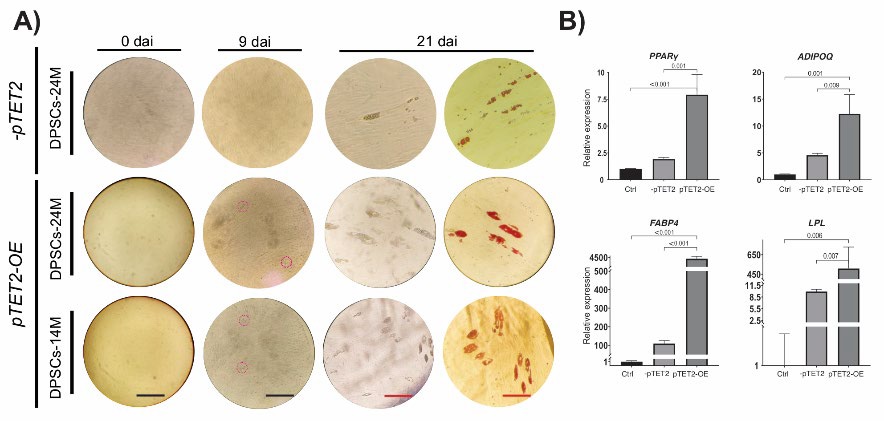
Fig. 3 Adipogenic differentiation of dental pulp stem cells (DPSCs). (A) Morphological analysis of DPSC undergoing adipogenic conditions at 0, 9, and 21 days after induction (dai). Red dashed circles indicate the presence of lipid droplets (LDs) in two independent cell lines overexpressing (+pTET2-OE) or not overexpressing (-pTET2) TET2. The presence of oil accumulation or LDs were visible through Oil Red Staining at 21 dai. (B) qPCR analysis of adipogenesis-related genes (PPAR(, ADIPOQ, FAB4 and LPL) of DPSCs at 21dai. DPSCs at 0 dai were used as control for qPCR analysis. The data show gene expression normalized to the housekeeping gene (18S rRNA). The values above the brackets indicate the p values with significant differences. The black (for 0 and 9 dai) and red (for 21 dai) scale bars indicate 150 and 40 (m, respectively.
Conclusion
Our study suggests that overexpression of TET2 could modulate the transcriptional activity of adipogenic markers (PPAR(, ADIPOQ, FABP4, and LPL) that allow the synthesis and accumulation of lipids during adipogenic development in DPSCs. This finding opens the opportunity to know how TET2 modulates DNA methylation levels and how it interacts with enhancers or promoters of adipogenesis-related genes to drive the transition of DPSCs toward adipogenic commitment.

