


 nueva página del texto (beta)
 Inglés (pdf)
 Artículo en XML
 Referencias del artículo
 Enviar artículo por email
 Citado por SciELO
  Similares en
SciELO
Similares en
SciELO 
 Permalink
Introduction
Rare earth element concentrations (REEs) in seawater are primarily influenced by different sources (e.g. terrestrial input from continental weathering and sea-floor hydrothermal vents) and scavenging processes related to depth, salinity and oxygen levels (Elderfield, 1988; Greaves et al., 1999). REE chemistry is a valuable tool for investigating palaeoenvironments because the relative abundances of REE in hydrogenous sediments (i.e. autochthonous sediments deposited in basin waters) such as carbonate and chert, vary systematically depending on the influence of hydrothermal, terrestrial or marine inputs upon fluids in the basin (Van Kranendonk et al., 2003).
Marine chemical sediments mainly exhibit seawater-like REE+Y patterns that appear to be irrespective of geological ages (Shields and Webb, 2004; Bolhar and Van Kranendonk, 2007). Post Archean Australian Shale (PAAS) normalized seawater REE patterns exhibit uniform light rare earth elements (LREE) depletion, negative Ce anomaly, positive La anomaly and high Y/Ho ratios (e.g.De Baar et al., 1991; Bau and Dulski, 1996: Nagarajan et al., 2011; Madhavaraju and González-León, 2012) are differentiated from detrital input (flat pattern) and hydrothermal input (positive Eu anomaly, enriched LREE and MREE). Hydrothermal fluids mainly display REE+Y patterns with positive Eu anomaly and light to middle REE-enriched patterns when normalized to PAAS (Wheat et al., 2002). However, river water shows flat REE+Y patterns with slight light REE depletion and no anomalies and so marine and lacustrine carbonates can be easily distinguished (Bolhar and Van Kranendonk, 2007; Garcia et al., 2007). In ancient carbonate rocks, REEs provide important information regarding the marine and estuarine redox history (German and Elderfield, 1990; Bellanca et al., 1997) and palaeoceanography (Liu, et al., 1988; Shields and Webb, 2004). Nothdurft et al. (2004) distinguished REE patterns in microbialites that formed in estuarine fringing reefs versus offshore and more open marine settings.
The carbon and oxygen isotopic compositions, along with petrography of carbonate rocks, may prove to be powerful tools to trace fluid origin and to reconstruct large-scale movements and evolution of fluids (Allan and Matthews, 1982). The diagenesis of carbonate rocks includes all the processes that affect the sediments after deposition and up to the processes of metamorphism at high temperatures and pressures (Moore, 2001). Carbonate rocks deposited in marine environments mainly preserve the carbon isotopic composition of the ocean water (Scholle and Arthur, 1980). The stratigraphic correlation of marine carbonates by means of carbon isotope data has been applied to Cretaceous marine carbonate sediments (Jenkyns, 1995; Weissert et al., 1998; Moullade et al., 1998; Grotsch et al., 1998; Armstrong-Altrin et al., 2011; Madhavaraju et al., 2013a, 2013b).
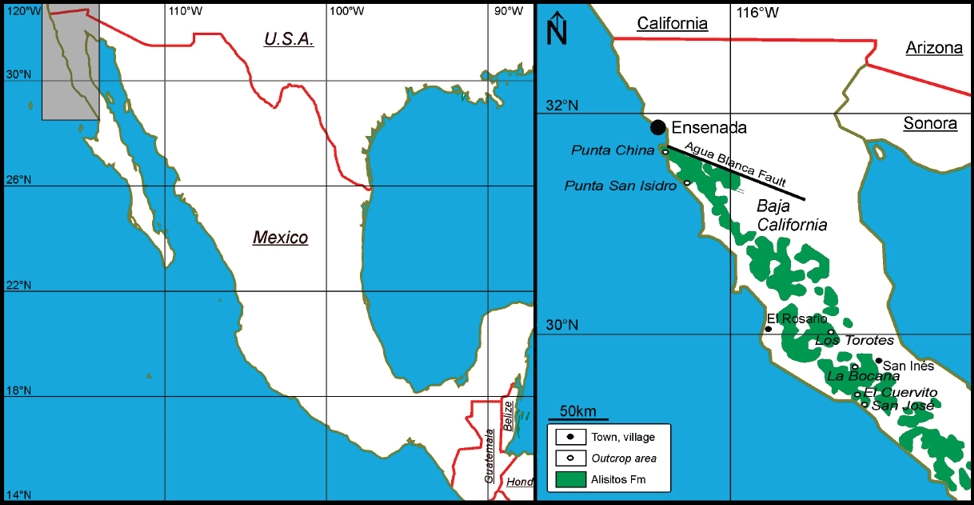
The Aptian-Albian Alisitos Formation is exposed across the western half of northern Baja California as a discontinuous belt 600 km long that trends parallel to the Pacific coast and is approximately 50 km wide. The Alisitos Formation exposed between Ensenada and La Bocana along the Baja California Peninsula has attracted the attention of many researchers for its extensive volcaniclastic strata (Tardy et al., 1993; Morán-Zenteno, 1994) and thick fossiliferous limestones (Allison, 1955, 1974). The marine sediments occur throughout the Alisitos Formation, however, the thicker sequences are found in the lower part (Wetmore et al., 2005). For the present study, limestone samples were collected from the well exposed section situated near Los Torotes (Almázan-Vázquez, 1988) (Figure 1). Stable isotope and geochemical (major, trace and REE) studies were undertaken on the limestones of the Alisitos Formation. The aims of the study are to document the influence of terrigenous materials on REE characteristics of carbonate rocks; to unravel the probable reason for significant variations in REE patterns; and to understand the diagenetic and depositional conditions in the limestones of the Alisitos Formation.
Geology and stratigraphy
The Cretaceous Alisitos Formation forms part of the Guerrero terrane (Campa and Coney, 1983) and is exposed in the northern part of Baja California (Figure 1). The first detailed study on the volcano-sedimentary sequences was carried out by Santillan and Barrera (1930) and they named these deposits the Alisitos Formation after the Alisitos Ranch in the Río Santo Tomás valley. The Alisitos Formation was derived from a volcanoplutonic arc developed along the western margin of Baja California during the Early Cretaceous (ca. 140-100 Ma; Busby 2004). The Alisitos Formation is estimated to be about 6,000 to 7,500 m thick and spans from at least Aptian to Albian in age (Allison, 1974; Wetmore et al., 2005).
The Los Torotes section between El Rosario and San Inés and the La Bocana section about 12 km northwest of San Inés were studied by Almazán-Vázquez and Buitrón-Sánchez (1984) and Almázan-Vázquez (1988). Paleontology, petrography and lithologic associations enable chronstatigraphic correlation between Los Torotes and La Bocana (SW San Inés) and El Cuervita - San Jose areas, which have different sedimentologic characteristics. The Los Torotes and La Bocana sections have 5,000 m thick sequences and have been interpreted to be a deposit of insular arc margin, whereas El Cuervita - San Jose areas shows a clear contrast because the strata here are 1,500 m thick and represents sedimentation in an insular fore-arc basin. The Alisitos Formation was deformed by the Oregonian Orogeny during the late Albian, which produced disharmonic synclines and anticlines, subsequently basement folds with wide radius of curvature and, finally, origination of a northwest-southeast trending regional fault with lateral displacement.
Los Torotes section
The Alisitos Formation is well exposed in the north of Los Torotes ranch, where a 3,500 m thick volcano-sedimentary sequence was measured (Figure 2). The Los Torotes Section has received much attention by many studies in recent decades because of its sedimentological variations, richness of fossils and easy accessibility to carry out research activities. Beggs (1984) did the earliest systematic description, however, he described only a small portion of the section.

The Alisitos Formation exposed in the Los Torotes area has been divided into six distinct informal members, viz. member A, B, C, D, E and F (Almazan-Vazquez, 1988). Among them, the carbonate rocks are well exposed in members C and E. Member A consists of interbedded recrystallized limestone and volcaniclastic rocks. The limestone beds are gray, laminated lenticular beds 2 to 9 m thick. The limestone beds are recrystallized in several places. The volcanic rocks are yellow and light green with cryptocrystalline tuffs and volcanic breccias 10 to 25 m thick. Member B is mainly composed of pyroclastic rocks (tuffs and volcanic breccias) interbedded with epiclastic rocks (sandstone and siltstone). Member C mainly consists of limestone with epiclastic rocks. Member D is mainly composed of lavas interbedded with tuffs. Member E consists of biohermal limestone, epiclastic rocks and pyroclastic rocks. Member F is mainly composed of pyoclastic rocks up to 2,500 m thick.
A detailed lithostratigraphic description of the Alisitos Formation is given in Figure 2. Samples were collected from the Los Torotes section and the observed lithological units are given in the lithostratigraphic columns (Figure 2). The present study focuses on the carbonate rocks exposed in the Los Torotes section and an interval only 350 m thick that mainly consists of Member C, Member D and Member E is measured. The base of the measured section is in Member C (Almazan-Vazquez, 1988), where only limestones, gypsum, siltstone and pyroclastic rocks are exposed (Figure 3a), whereas softer sediments such as marls or clays are covered with soil. Member C is overlain by a thick sequence of pyroclastic rocks, which is correlated with Member D (MD). Above is Member E, which is mainly fossiliferous limestone, nodular limestone, siltstone and thin beds of pyroclastic rocks (Figure 3b).

Materials and methods
Nineteen limestone samples from the Los Torotes section were selected for geochemical study (Figure 2) and these samples were powdered in an agate mortar. Major oxides composition was obtained by X-ray fluorescence in fused LiBO2/Li2B4O7 disks using an X-ray fluorescence spectrometer (Siemens SRS-3000) with an Rh-anode X-ray tube as a radiation source. X-ray absorption/enhancement effects were corrected using the Lachance and Traill (1966) method, included in the SRS-3000 software. One gram of sample was heated to 1,000 ºC in porcelain crucibles for 1 hour to measure the Loss-on-Ignition (LOI). The geochemical standard ES-3 was used to determine data quality (Table 1). The analytical accuracy errors were better than ±2% for SiO2, Fe2O3 and CaO, better than ±3% for MnO and P2O5 and better than ±7% for MgO. The accuracy errors were more than ±10% for Al2O3, Na2O, K2O and TiO2.
Table 1 Comparison of major oxide data for ES-3 reference sample with certificate of analysis data as well as limits of detection (LOD) data for XRF analyses.
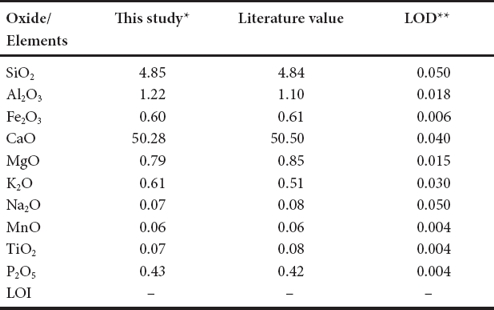
* Major elements in wt % are by XRF; ** LOD (limit of detection) in wt%; - : not determined or not reported; LOI: Loss on ignition.
Trace and rare earth elements were determined by an Agilent 7500 CE Inductively Coupled Plasma Mass Spectrometer (ICP-MS) according to standard analytical procedures suggested by Eggins et al. (1997). The geochemical standards JLS1 and IGLa-1 were used to monitor the analytical reproducibility. The analytical results of JLS1 and IGLa-1 are compared with published values (Govindaraju, 1994) to check the quality and accuracy of the analyses (Table 2). PAAS values were used for REE-normalized diagrams (Taylor and McLennan, 1985). Such normalization highlights the differences in abundance between detrial sources (shale contamination) and the residual inventory in seawater after modification in the marine environment and further removal by adsorption on surfaces of suspended and sinking particles. Using PAAS normalized values, the anomalies are expressed as Ce/Ce* = Ce/(2Pr-1Nd) and Pr/Pr* = Pr/(0.5Ce+0.5Nd) (Bau and Dulski, 1996; Bolhar et al., 2004).
Table 2 Comparison of data of trace and rare earth elements for IGLa-1 and JLs-1 reference samples.
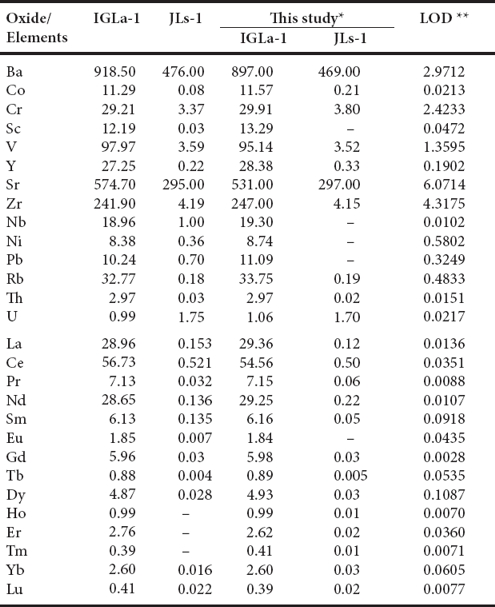
* Trace and rare earth elements in ppm by ICP-MS. ** LOD (limit of detection) in ppb; - : not determined or not reported.
Nineteen limestone samples were selected for stable isotopic study. The carbon and oxygen isotope compositions were analyzed using an SIRA II mass spectrometer at the Stable Isotope Laboratory (LABISE) of the Federal University of Pernambuco, Brazil. The limestone samples were treated with H3PO4 in a vacuum at 25°C for one day for the determination of carbon and oxygen isotopes and the resulted CO2 gas analyzed according to the method described by Craig (1957). CO2 gas released by this method was analyzed in a double inlet, triple collector SIRA II mass spectrometer using the reference gas BSC (Borborema Skarn Calcite), which was calibrated against NBS-18, NBS-19, and NBS-20 and has a value of -11.28 ± 0.004 ‰ VPDB for δ18O and -8.58 ± 0.02 ‰ VPDB for δ13C. The results reported in the notation δ‰ (per mil) in relation to international VPDB scale.
Results
Lithofacies and diagenesis
Member C
Member C is composed of two intervals of limestone about 20 m thick each separated by volcanoclastic strata The interval from 29 m to 50 m is dominantly bedded rudist bioclastic packstone (thin sections LT35 - LT31; Figures 4a, 4b; Table 3). Bivalves including caprinid racists and other rudists and echinoderm closets are the principle carbonate grain types; coral fragments are in one sample. The uppermost two beds are unfossiliferous lime mudstone interbedded with volcanoclastic beds (Figure 4c). Non-carbonate grains are in trace amounts; at the base are lithoclasts and higher samples have quartz, feldspar, volcanoclasts (Figure 4d), and chert grains. The next higher interval of Member C from 67 to 83 m is composed of rudist bioclast packstone (Figures 4e, 4f) with echinoderm plates; one sample has the calcareous alga, Cayeuxia sp. (thin sections LT28 - LT24). The topmost sample is chondrodontid bioclastic packstone.
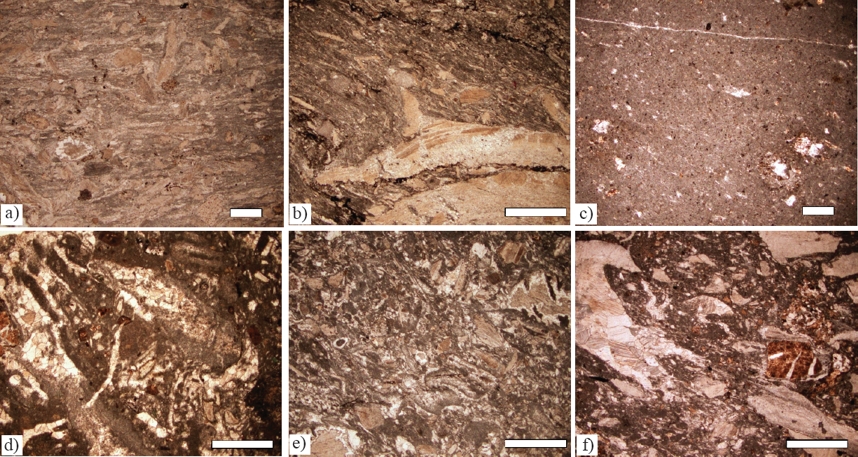
Figure 4 a) Bioclastic packstone, LT-32. b) Caprinid bioclastic packstone with calcite lineations, LT-34, c) Lime mudstone with incipient stylolites, LT-31. d) Bioclastic packstone, rudist and coral bioclasts, LT-33. e) Bioclastic packstone with chondrodontid clasts and chert rims partly replace bioclasts, LT-24, f) Volcanoclastic rudist-peloid bioclastic packstone, LT-28. Scale bar for figures c, e = 250 μm; scale bar for figures a, b, d, f= 500 μm.
Table 3 Petrography of Alisitos Formation, Los Torotes Section - Baja California (in stratigraphic order; wkst: wackestone, pkst: packstone, dolo: , qtz quartz, feld: feldspar).
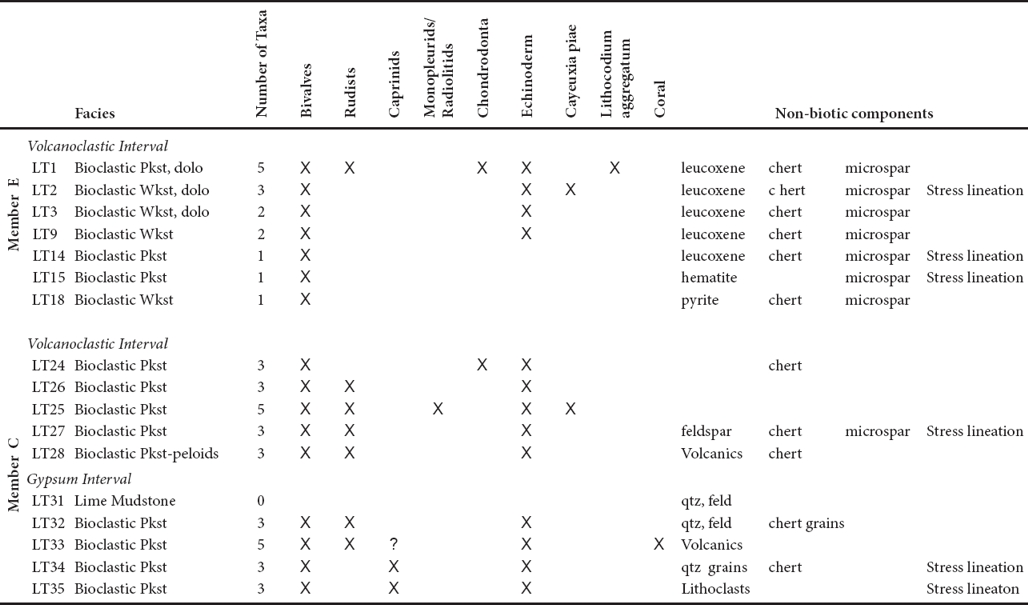
The micrite matrix was recrystallized in places and chondrodont shells were partly replaced by silica (Figure 4e). During burial some samples experienced compaction and stress (Figure 4b) followed by formation of thin wavy to irregular stylolites infused by opaque minerals (Figure 4b). The resolvable paragenetic succession is: 1) encrustation of bioclasts by cyanobacteria resulting in micritic films; 2) formation of opaque minerals; 3) recrystallization of micrite matrix; 4) chert partly replacing shells and locally matrix; 5) burial and formation of stylolites and calcite stress lineations; and 6) alteration of iron-bearing minerals.
Member E
Oyster bioclast packstone-wackestone comprises the interval from about 240 m to 322 m (Figure 5a).The lower three samples have no echinoderm bioclasts. The upper samples have echinoderms and calcareous algae as well as bivalves. Rare are Cayeuxia sp. nodules (Figure 5b) and few bioclasts are bored and encrusted by micritic rims and Lithocodium (Figure 5a). Prismatic bivalve clasts appear to be requienid shell and small circular fossils with thick prismatic wall may be monopleurids (Figures 5a, 5b). Opaque minerals appear to be the only accessory minerals.
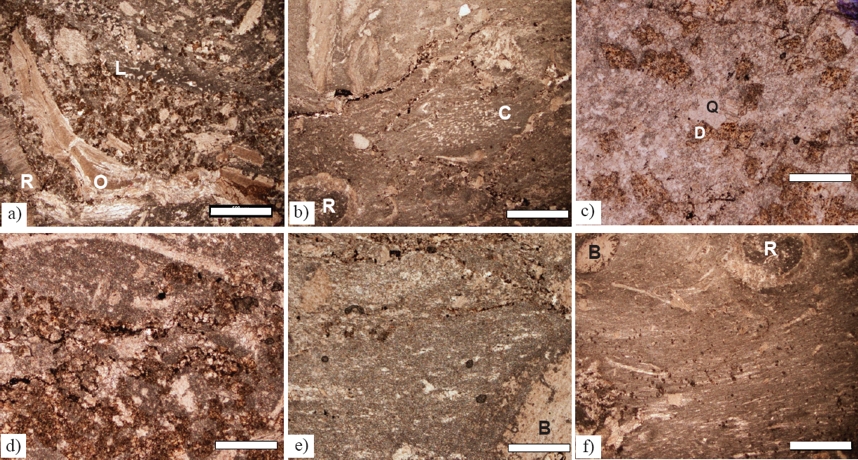
Figure 5 a) Dolomitic bivalve bioclast packstone, LT- 1; (O - oyster clast, R - rudist clast, L - Lithocodium encrusting bioclastic fill of oyster). b) Wackestone matrix with Cayeuxia nodule (C) and possible monopleurid rudist (R), LT- 2.2. c) Microspar matix with dolomite (D) growing into quartz (Q), LT- 1. d) Wavy-irregular stylolite partly filled with opaque material and dolomite, LT- 1. e) Wavy-irregular stylolites partly filled with opaque material and dolomite; bored bioclast with micrite rim (B), LT- 2. f) Lineated calcite blades and shells; in upper left-hand corner bored bioclast with micrite rim (B), to right is small oval bivalve shell, possibly a monopleurid rudist (R), LT- 2. Scale bar = 500 μm.
The micritic matrix is partly crystallized to microspar (Figure 5c. Chert partly replaces shells and in a few places matrix (Figure 5c). Wavy to irregular thin stylolites crosscut the depositional fabric (Figures 5b, 5d, 5e). Opaque grains partly replace bioclasts and matrix and line wavy stylolites (Figures 5b, 5d, 5e). The opaque material is a dull grayish-yellow color suggestive of leucoxene, and higher in the section it has the silvery color of hematite and in the upper samples pyrite is present. Stress lineations are thin elongate subparallel calcite stringers (Figures 5e, 5f) that parallel stylolites. In the upper three samples, dolomite euhedra are scattered across the matrix and replace bioclasts and intrude chert crystals, lineations and stylolites (Figures 5c, 5d). The dolomite has a golden color suggesting that it may be iron-rich, and in places dolomite includes opaque red-brown hematitic material. The resolvable paragenetic succession is: 1) encrustation of bioclasts by cyanobacteria resulting in micritic films and borings; 2) formation of opaque iron-bearing minerals; 3) recrystallization of micrite matrix; 4) chert partly replacing shells and locally matrix; 5) burial and formation of stylolites and calcite stress lineations; and 6) crystallization of fe-rich dolomite euhedra; and 7) alteration of iron-bearing minerals.
Stable isotopes
The carbon and oxygen isotopic variations are given in Table 4. The MC shows negative δ18O values from -12.99 to -6.84‰. Likewise, the ME also shows significant negative oxygen isotope values (-14.17 to -8.2‰). Both MC and ME show positive δ13C values (+3.33 to +5.26‰; +4.13 to +4.88‰; respectively).

Elemental variations
The concentrations of major oxides in limestones are given in Table 5. Both MC and ME show large variations in Al2O3 concentration (0.61 to 2.63%; 0.16 to 1.50%; repectively). SiO2 concentration is higher in MC (3.40 - 28.97%) than ME (2.45 - 8.53%). The CaO concentration of limestones in ME (48.96 to 53.90%) are greater than in MC (36.99 to 52.69%). Na2O and K2O contents are lower in ME (0.07 to 0.48%; 0.01 to 0.40%; respectively) than in MC (0.15 to 1.21%; 0.14 to 0.93%; respectively).
Table 5 Major oxides (wt%) concentrations of limestones of the Los Torotes section of the Alisitos Formation.
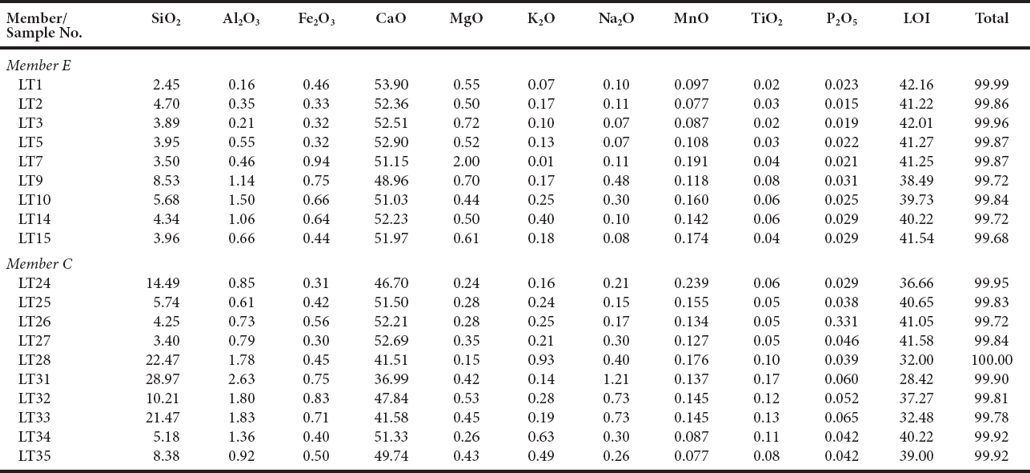
LOI: Loss on ignition.
The limestones of both MC and ME show large variations in Zr content (4 to 30 ppm; 3 to 20 ppm). Low contents of Co, Rb, Pb, Nb, Hf, Th and U are observed in the studied limestones (Table 6). Maximum concentration of Ba is found in MC (LT28: 222 ppm, Table 6). PAAS normalized trace element concentrations are plotted in Figure 6. The large-ion lithophile elements like Rb and Ba are extremely depleted compared to PAAS. The limestones are slightly enriched in Sr when compared to PAAS. The high-field strength elements (Zr, Y, Nb, Hf and Th) and ferromagnesian trace elements (Co, Ni, Cr and V) are depleted in all limestone samples with respect to PAAS.
Table 6 Trace elements (ppm) concentrations of limestones of the Los Torotes section of the Alisitos Formation.
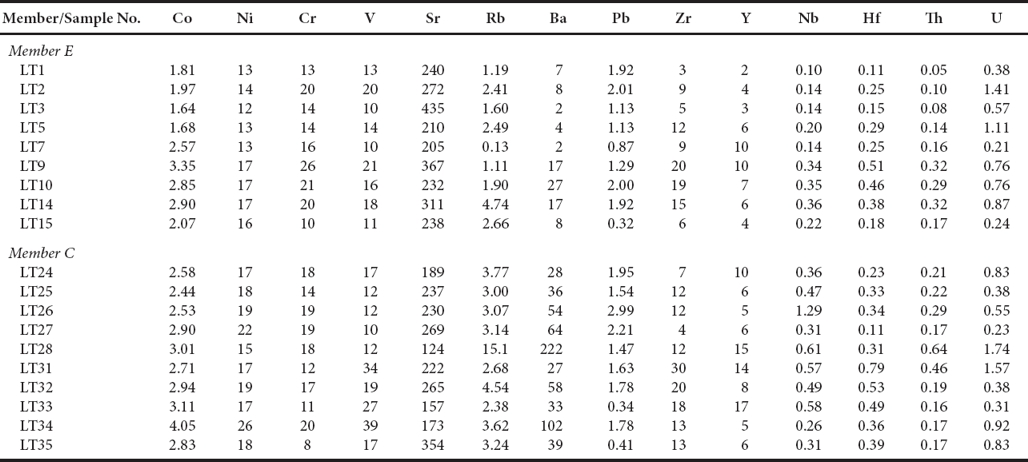
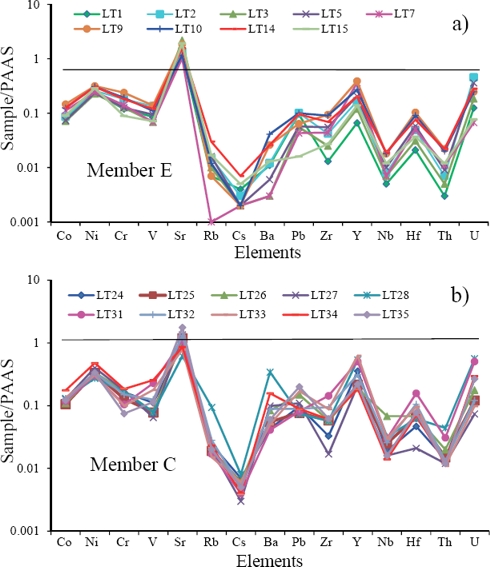
Figure 6 a) PAAS-normalized trace element diagrams for limestones of the Member C of the Alisitos Formation, and b) PAAS-normalized trace element diagrams for limestones of the Member E of the Alisitos Formation.
ΣREE contents are lower in ME (2.86 - 18.96 ppm) than in MC (8.50 - 62.12 ppm; Table 7). PAAS-normalized REE patterns of the Alisitos limestones are given in Figure 7. The limestones of ME exhibit seawater-like REE+Y patterns with 1) LREE depletion (NdN/YbN = 0.32 - 0.56, 0.44 ± 0.07, n=9; Table 8; NdN/YbN of modern shallow water = 0.21 to 0.49 at 50 m water depth, Zhang and Nozaki, 1996; de Baar et al., 1985; respectively), 2) negative Ce anomalies (Ce/Ce* : 0.67 - 0.94, 0.84 ± 0.09, n=9; Table 8), and 3) higher Y/Ho ratio (36.3 - 52.2, 44.0 ± 5.9, n=9; Y/Ho of seawater = 44 - 74, Bau, 1996). The limestones of MC show non-seawater-like REE+Y patterns and are significantly enriched in MREE, with lower Y/Ho ratio (33.8 - 47.4, 38.2 ± 3.8, n=10; Table 8), and less negative to positive Ce anomalies (0.84 - 1.04, 0.95 ± 0.07, n=10). ME shows greater variations in the Eu anomaly (0.79 - 2.91, 1.18 ± 0.65, n=9) than MC (0.58 - 1.13, 0.93 ± 0.19, n=10; Table 8). One sample from ME has a significantly positive Eu anomaly (Eu/Eu*: 2.91).
Table 7 Rare earth elements (ppm) concentrations of limestones of the Los Torotes section of the Alisitos Formation.
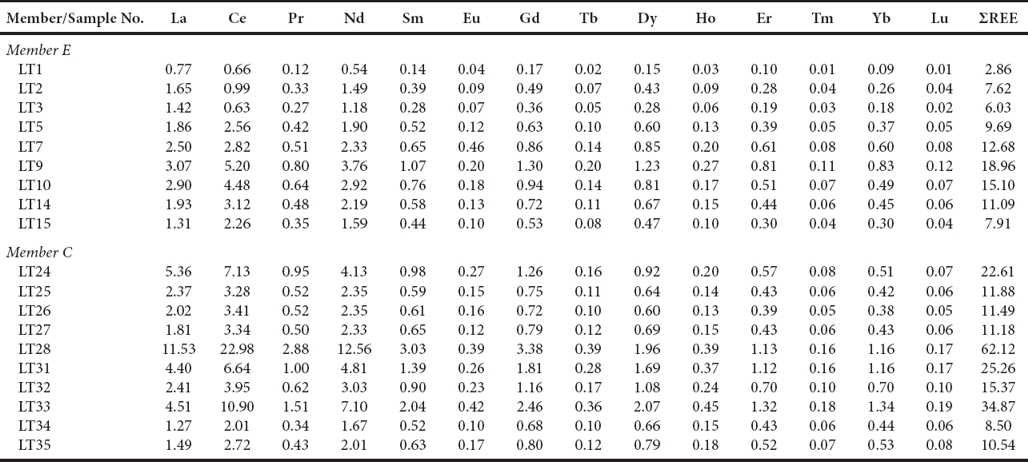
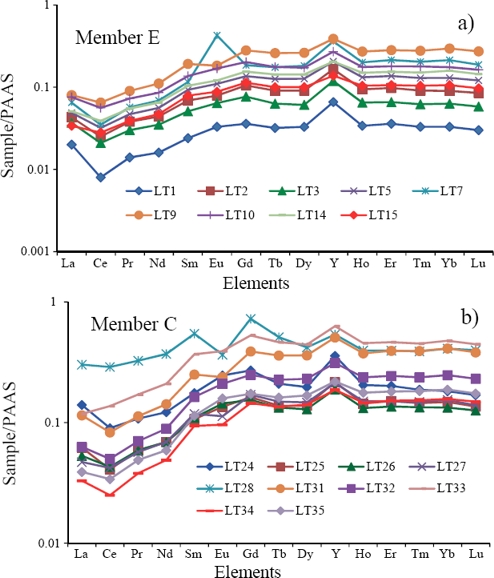
Figure 7 a) REE patterns of limestones of the Member C of the Alisitos Formation, and b) PAAS normalised REE patterns of the Member E of the Alisitos Formation.

Discussion
Depositional environments
Member C overlies a nearly 20 m-thick gypsum interval. The lower rudist packstone samples suggest a normal marine environment with rudist accumulations nearby that were established after hypersaline conditions. The overlying lime mudstone suggests that shallow shelf conditions were followed by restricted conditions such as either a deeper outer shelf or a very shallow paralic environment. The absence of microfossils in the mudstone samples suggests inhospitable conditions or unrepresentative samples. The upper interval of MC represents a return to a shallow marine shelf with rudist buildups. The uppermost sample with chondrodonts represents a shallow marine lagoon.
In Member E, the lower interval has low diversity bivalves suggesting that salinity became less than normal. Oysters, chondrodonts(?), rudists, calcareous algae, and echinoderm clasts in the upper interval suggest that marine waters probably were near normal salinity; strong currents broke and imbricated shells probably by periodic storms. The overall depositional environment was a shallow shelf during transgression and rising sealevel.
Carbon and oxygen isotopic variations
The limestones from the entire section show distinct negative oxygen isotope values (-14.17 to -6.84‰ VPDB; Table 4; Figure 8). The most negative values are in the upper part of MC and lower part of ME. The variations in δ18O compositions may be due to fluctuations in local marine baseline compositions, possibly related to climate. More negative δ18O values are related to salinity and temperatures (Hudson, 1977), which suggests that cementation took place under mainly burial and/or meteoric conditions. During diagenesis, the original calcite may have been altered by calcite precipitated in the diagenetic environment, whether during burial or on the sea floor (Fisher et al., 2005). Oxygen isotopic composition is more vulnerable to diagenesis than carbon isotopes, which is partly due to the temperature-related fractionation seen in oxygen isotopes (Morse and Mackenzie, 1990). The observed significant negative oxygen isotopic values in the Los Torotes section may be related to diagenetic modification. Diagenesis is also indicated by petrographic observations, which shows recrystallization of original shell minerals and stress lineations.
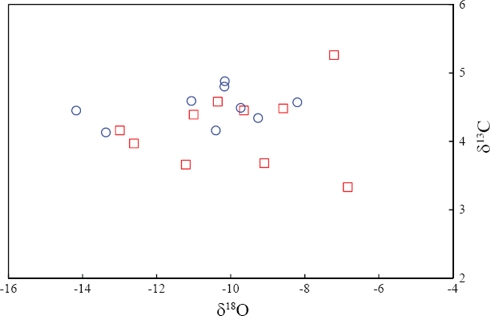
Figure 8 δ13C versus δ18O bivariate plot for limestones of the Alisitos Formation (Symbols: □ - Member E; ○ - Member C).
Modern marine carbonate sediments normally have positive 13C values ranging from 0‰ to 4‰ (Hudson, 1977; Moore, 2001). Short-term variations in the δ13C signals of shallow water carbonates are widely used to identify the primary variations in the Early Cretaceous oceanic δ13C signature (Jenkyns, 1995; Vahrenkamp, 1996; Grötsch et al., 1998). Limestones from the Los Torotes section have positive carbon isotope values (+3.33 to +5.26‰ VPDB).
Carbon isotopes are less affected by diagenesis than oxygen isotopes (Hudson, 1977; Banner and Hanson, 1990; Marshall, 1992; Frank et al., 1999), because of the buffering effect of carbonate carbon in the diagenetic system (Price et al., 2008). The positive correlation between carbon and oxygen values indicates diagenetic alteration of carbonate rocks (Hudson, 1977; Allen and Matthews, 1982; Fisher et al., 2005). Such a positive correlation between δ13C and δ18O values (MC: r=0.12, n=10; ME: r=0.33, n=9; the linear correlation coefficient (r) between these isotopes is not statistically significant, see Verma, 2005, for statistical significance of r values) is lacking in the limestones from MC and ME of Los Torotes section (Figure 8). This suggests that the carbon isotopic values unchanged during diagenesis (e.g., Jenkyns, 1974; 1996; Jenkyns and Clayton, 1986).
Behaviour of Europium
Limestones of ME and MC have both negative and positive Eu anomalies (Eu/Eu*: 0.79 - 2.91; 0.58 - 1.13; respectively, Table 8). REE composition of modern clastic sediments and seawater chemical precipitates mainly display the composition of the upper crustal rocks, which have distinctly negative Eu anomalies (Piper, 1974; Elderfield and Greaves, 1982). PASS-normalized positive Eu anomalies are not common in seawater. Positive values result from hydrothermal solutions (Michard et al., 1983; Klinkhammer et al., 1983,; German et al., 1993; Sherrell et al., 1999), from sediments affected by diagenesis (MacRae et al., 1992), by enrichment of feldspar (Murray et al., 1991; Madhavaraju and Ramasamy, 1999; Madhavaraju and Lee, 2009; Madhavaraju et al., 2010, 2016), by sediments derived from high T-basalt alteration along mid-ocean ridges, or from back arc spreading centres (Michard et al., 1983; German et al., 1993; Siby et al., 2008).
MacRae et al. (1992) noted that Amazon fan muds exhibit significant positive Eu anomalies, because of precipitation of Eu2+ from pore waters during diagenesis. Eu content is positively correlated with Y in limestones from both MC and ME (r=0.95, 0.80, respectively; Figure 9a) and reveals the non-diagenetic origin of this element. The inclusion of small amounts of detrital feldspars may lead to positive Eu anomalies in the bulk sediments (Murray et al., 1991; Madhavaraju and Lee, 2009; Madhavaraju et al., 2010). In addition, Al2O3 is not correlated with Eu/Eu* (MC: -0.57; ME: -0.25; respectively; Figure 9b). Hence the positive Eu anomalies in these limestones seem to have not been influenced by the amount of feldspars in them. Because intense diagenesis or higher feldspar content are not reported from these limestones, the positive Eu anomalies observed here may be due to hydrothermal fluids or co-precipitation of hydrothermal Fe-sulphides.
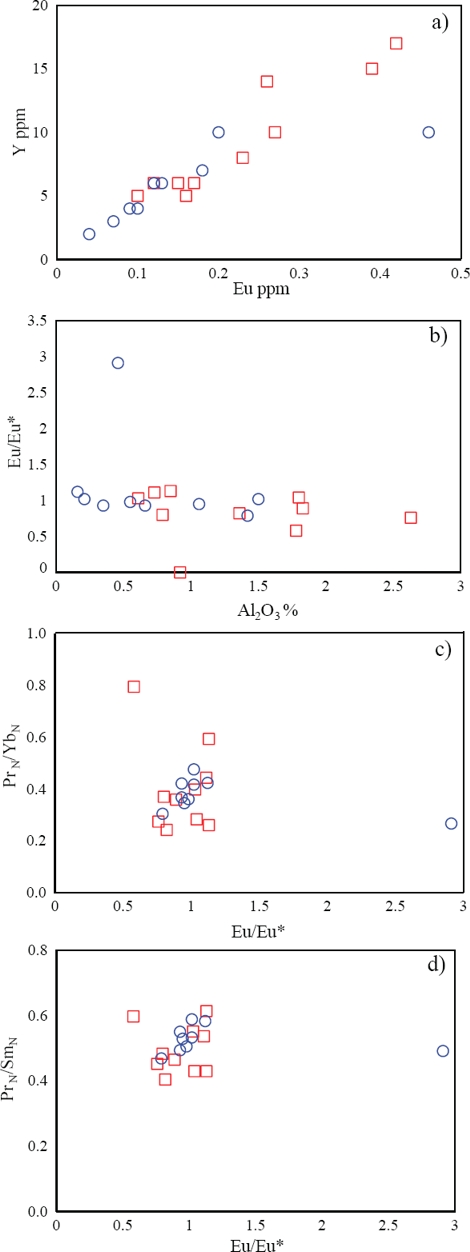
Figure 9 a) Y vs Eu bivariate plot, b) Eu/Eu* vs. Al2O3 bivariate plot, c) PrN/YbN vs. Eu/Eu* bivariate plot and d) PrN/SmN vs. Eu/Eu* bivariate plot for limestones of the Alisitos Formation (Symbols: □ - Member E; ○ - Member C).
The Eu3+/Eu2+ redox potential in aqueous solutions mainly depends on variations in temperatures and to a minor extent on pressure, pH and REE speciation (Bau, 1991), which explains the positive Eu anomalies found in acidic, reducing hydrothermal fluids (Kamber et al., 2004). Eu/Eu* ratios of the Alisitos limestones exhibit no correlation with PrN/YbN (MC: -0.22; ME: -0.54; respectively; Figure 9c) and PrN/SmN (MC: 0.14; ME: -0.22; respectively; Figure 9d) ratios. This implies that Eu was decoupled from other redox-sensitive REEs due to the interaction of hydrothermal solutions with Cretaceous seawater during the deposition of limestones of the Alisitos Formation. The Rosario segment of the Alisitos arc was the site of several hydrothermal activities during the Early Cretaceous (Busby et al., 2006). In the northern part of the Nuevo Rosarito plutonic suite, diorite of Lower Cretaceous age is cut by numerous amphibole veins of probable hydrothermal origin (Peña-Alonso et al., 2012). In addition, Peña-Alonso et al. (2012) identified altered pyroxene (moderately altered to uralite) in Lower Cretaceous gabbroic rock which produced by scavenging hydrothermal activity. These observations suggest that the sedimentary basin might have been affected by hydrothermal events during Early Cretaceous. Thus, the observed positive Eu anomalies in many samples may be the product of hydrothermal fluids or co-precipitation of hydrothermal Fe-sulfide.
Possible source of REEs in the Alisitos Formation
The evaluation of seawater chemistry in the geological past is mainly dependent upon geochemical proxies thought to reflect contemporaneous seawater composition. Recent studies have shown that microbial carbonates are considered to be reliable proxies for assessment of ancient seawater REE geochemical signatures (Webb and Kamber, 2000; Olivier and Boyet, 2006; Oliveri et al., 2010).
The ΣREE content of limestoens of the Alisitos Formation is moderately positively correlated with elements representative of fine-grained and sand-sized detritus such as Al and Si (r=0.64; r=0.80; respectively). However, the correlation between NdN/YbN and Al2O3 of the samples is negative (r= -0.29, n=19). Hence, the absence of a positive correlation between NdN/YbN and Al2O3 may result from sample heterogeneity. In any case, a high Al2O3 content is not correlated with and low LREE depletion (high NdN/YbN) in the studied limestones. The LaN/YbN ratios of the limestones (MC: 0.21 - 0.77; ME: 0.27 - 0.61; Table 8) are significantly lower than the values proposed by Condie (1991; about 1.0) and Sholkovitz (1990; about 1.3) for terrigenous materials. In addition, the relative REE contents in the limestones can be tested using the parameters, such as PrN/SmN and PrN/NdN, which do not correlate with Al2O3 and ΣREE contents.
The limestones of Member C have non-seawater-like REE+Y patterns whereas limestones of Member E show distinctly seawater-like patterns (Figure 7). The non-seawater-like patterns result from the presence of detrital contaminants that effectively mask a seawater signature in the limestone because of their high REE concentrations (flat pattern: German and Elderfield, 1990; Elderfield et al., 1990; Bau and Dulski, 1996; Webb and Kamber, 2000). The inclusion of terrigenous materials in the limestones may be assessed by determining the abundance of Al2O3 and Th (Nothdurft et al., 2004). The concentration of Al2O3 is lower in Member E (0.71 ± 0.5, n=9) than in Member C (1.33 ± 0.66, n=10) (Table 5). Fe2O3 content of Member E correlates well with the abundances of Zn, Mn, Co, Eu, Y and ΣREE whereas the limestones of Member C show no such correlation with these elements. These elements are known to be partially associated with or incorporated into amorphous Fe and Mn oxyhydroxides which suggests hydrothermal events affected Member E of the Alisitos Formation. Hydrothermal input is a source of Fe and Mn oxyhydroxides, which incorporates REEs disproportionately and unpredictably. However, this input was not strong enough to obscure the REE geochemistry of seawater in the limestones of Member E during the Albian.
The limestones of Member E have distinct seawater-like REE+Y patterns (Figure 10a), which compare with modern seawaters (Figure 10b) and marine limestones yielding similar REE patterns (Figure 10c; Upper Devonian carbonate sediments, Nothdurft et al., 2004; Permian Limestone, Kawabe et al., 1991; Mural Limestone, Madhavaraju and González-León, 2012; Albian-Cenomanian Limestone, Bellanca et al., 1997; Holocene reefal microbialite, Webb and Kamber, 2000). However, Member C exhibits non-seawater-like patterns, which compare with other limestones that exhibit non-seawater-like patterns (Figure 11; Upper Devonian coastal fringing reef, Nothdurft et al., 2004; Aptian-Albian limestone: Madhavaraju et al., 2010; Albian limestone, Madhavaraju and Lee, 2009; Maastrichtian limestone, Madhavaraju and Ramasamy, 1999; Miocene limestone, Armstrong-Altrin et al., 2003). This suggests that the inclusion of terrigenous materials in carbonates as contaminants will mask the seawater signature because of their high REE concentration.
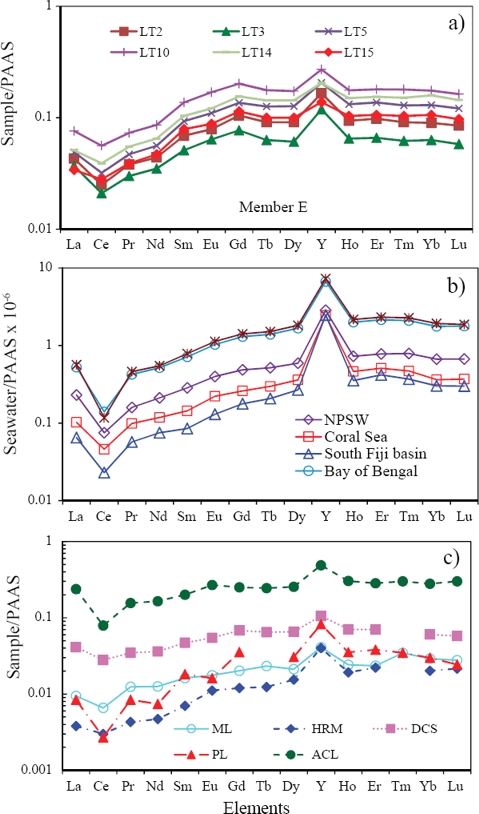
Figure 10 a) PAAS normalized REE patterns of representative samples of the Member E compared with, b) PAAS normalized REE patterns of modern seawaters (NPSW: North Pacific shallow water, Sagami trough (Alibio and Nozaki, 1999), Coral Sea: Coral sea (South Pacific shallow seawater, Zhang and Nozaki, 1996), South Fiji Basin: South Fiji Basin - Station SA12 (Zhang and Nozaki, 1996), Bay of Bengal: Bay of Bengal shallow water (Nozaki and Alibio, 2003) and Andaman Sea: Andaman Sea shallow water (Nozaki and Alibio, 2003), and c) PAAS normalized REE patterns of marine limestones yielding similar REE patterns (Upper Devonian carbonate sediments, Nothdurft et al., 2004; Permian Limestone, Kawabe et al., 1991; Mural Limestone, Madhavaraju and Gonzalez-Leon, 2012; Albian-Cenomanian Limestone, Bellanca et al., 1997; Holocene reefal microbialite, Webb and Kamber, 2000).
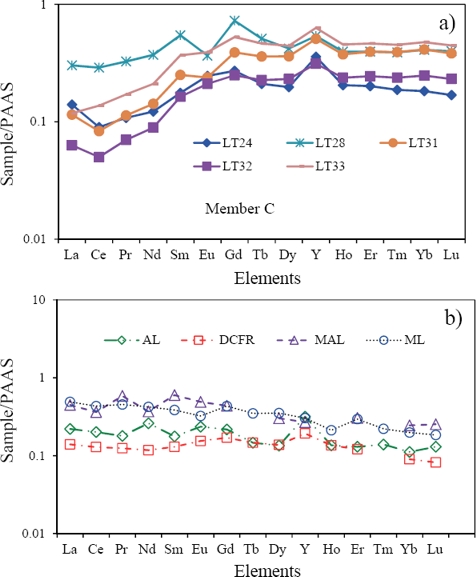
Figure 11 PAAS normalized REE patterns of the Member C are compared with limestones exhibit non-seawater-like signatures (DCFR: Late Devonian coastal fringing reef (Nothdurft et al., 2004), AL: Albian limestone (Madhavaraju and Lee, 2009), MAL: Maastrichtian limestone (Madhavaraju and Ramasamy, 1999) and ML: Miocene limestone (Kudankulam Formation, Armstrong-Altrin et al., 2003).
The concentrations of certain immobile elements like La and Th are higher in silicic than in basic igneous rocks and aid in identifying the source rocks of terrigenous materials (Cullers, 1995). The felsic and mafic rocks show significant variations in La/Sc, La/Co, Th/Sc, Th/Co and Th/Cr ratios which are most useful in understanding the provenance composition (Wronkiewicz and Condie, 1990; Cox et al., 1995; Cullers, 1995). The extent to which these elemental ratios are useful in unraveling the provenance of terrigenous materials present in the carbonate rock is clearly addressed by Cullers (2002). The La/Sc, La/Co and Eu/Eu* ratios of the Los Torotes MC limestones are comparable to fine fractions of felsic and mafic rocks, and with upper continental crust (UCC) and PAAS values (Table 9). It suggests that terrigenous materials present in MC were derived from mafic to felsic source rocks. Furthermore, our results are consistent with the Cretaceous geology of Baja California (Suárez-Vidal, 1987; Busby, 2004).
Table 9 Range of elemental ratios of Member C of Alisitos Formation compared to felsic rocks, mafic rocks, Upper Continental Crust (UCC) and Post-Archaean Australian Shale (PAAS).
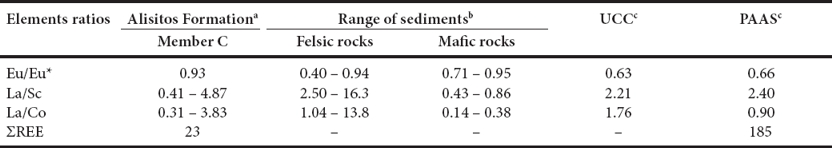
a Present study n=10; bCullers (1994, 2000), Cullers and Podkovyrov, 2000; cTaylor and McLennan, 1985.
Conclusions
Limestones of the Alisitos Formation collected from the Los Torotes section are mudstone, wackstone and packstone lithofacies. The presence of corals and rudist bivalves in a fine-grained matrix in the lower part of the section indicates normally quiet and relatively shallow marine conditions of a lagoon or inner shelf setting. In addition, the upper part of the section has caprinid, rudists and calcareous green algae (Cayeuxia) assemblages, which also supports shallow marine depositional environment for the Alisitos Formation. The limestones have large variations in both δ13C and δ18O values. The lack of positive correlation between δ13C and δ18O values indicates that the δ13C values measured in the Los Torotes section are primary in nature.
The limestones of ME exhibit seawater-like REE+Y patterns whereas MC has non-seawater-like REE+Y patterns. Fe2O3 content of ME correlates well with the abundances of Zn, Mn and Co and Eu, Y and ΣREE whereas MC reveals no such correlation with these elements. These elements are known to be partially associated or incorporated into amorphous Fe and Mn oxyhydroxides which suggest hydrothermal events during deposition of ME of the Alisitos Formation. The seawater-like-REE patterns in limestones of ME suggests that most of the REEs present in them were derived from the seawater rather than detrital materials. However, MC contains significant amount of terrigenous contaminants, which effectively mask the seawater signatures owing to their elevated REE concentrations. Both MC and ME show negative and positive Eu anomalies. The observed positive Eu anomalies in many samples may be the product of hydrothermal fluids or co-precipitation of hydrothermal Fe-sulfide. The elemental ratios like La/Sc, La/Co and Eu/Eu* suggest mafic to felsic sources for the terrigenous particles present in the MC limestones,

