


 nueva página del texto (beta)
 Inglés (pdf)
 Artículo en XML
 Referencias del artículo
 Enviar artículo por email
 Citado por SciELO
  Similares en
SciELO
Similares en
SciELO 
 Permalink
1. Introduction
CuInTe2 is a well-known semiconductor of the I-III-VI2 family, which crystallizes in a chalcopyrite structure, space group I 2d (N◦121), with unit cell parameters a = 6.194(2) Å and c = 12.416(4) Å [1,2]. Recently, attention has been focused to explore their potential application in thermoelectric technology due to their moderate electrical transports and low thermal conductivity. A dimensionless figure of merit zT(= α 2 σT/κ, where α, σ, T, and κ are Seebeck coefficient, electrical conductivity, absolute temperature, and thermal conductivity, respectively) of 1.18 at 850 K has been reported, which is better than any other un-doped diamond-like material [3]. To enhance the figure of merit, CuInTe2 can be doped or alloyed; throughout these procedures, it is possible to tune the carrier concentration optimizing both electrical conductivity (σ) and power factor (α 2 σ) and also to create extrinsic defects which could greatly alter the electron and phonon transport properties. It has been reported [4] that when CuInTe2 is doped with Cd according with the general expression CuIn 1−x CdxTe2 (with x = 0,0.02, 0.05, and 0.1) the zT values were improved by over 100% at room temperature and around 20% at 600 K for x = 0.02 and 0.1, respectively. It had been also reported [5] that (CuInTe2) 1−X (ZnTe) X solid solutions (simultaneous Zn2+ substitution for both Cu+ and In3+) have a lower thermal conductivity than CuInTe2 and attained zT = 0.69 at 737 K, which is 1.65 times higher than the zT value of Zn-free CuInTe2.
Following this reasoning, the (CuInTe2) 1−X (ZnTe) X solid solutions system has been investigated, and more particularly the sample CuFeInTe3, which corresponds to the value of x = 0.5 (see Fig. 1). This quaternary compound is a semiconductor, belonging to the I-II-III-VI3 family, which has been studied for spintronic applications with interesting magnetic, thermal and thermoelectric properties. GrimaGallardo et al. suggest a super-paramagnetism behavior for CuFeInTe3 [6,7] and Cabrera et al. [8] have demonstrated that CuFeInTe3 is a promising n-type thermoelectric material applicable at high temperatures.

For this compound, there are no reports on its powder diffraction pattern or its crystalline structure in the appropriate databases reviewed: Powder Diffraction File [9], Inorganic Crystal Structure Database (ICSD) [10], and Springer Materials [11]. Hence, here we present the structural characterization of the quaternary compound CuFeInTe3 using the Rietveld method to establish its crystal structure and report its powder X-ray diffraction data. The chemical structure was validated using the Bond Valence Sum (BVS) calculations [12,13].
2. Experimental
2.1. Synthesis
The chemical elements Cu, Fe, In, and Te (99.99% of purity, GoodFellow) in stoichiometric quantities, were introduced into a synthetic silica glass ampoule and sealed under vacuum (∼ 10−4 Torr). This ampoule was subjected to pyrolysis to avoid reaction of the starting materials with silica glass. The mixture was slowly heated up to 1500 K at a rate of 20 K/h, with a stop of 48 h at 722.5 K (melting temperature of Te) to maximize the formation of binary species at low temperature and minimize the presence of unreacted Te at high temperatures. To ensure complete mixing of all elements, the ampule was kept under constant stirring. At the maximum temperature (1500 K) the ampoule was kept for 48 h and it starts cooling at a rate of 20 K/h, until 873 K which was kept for 30 days. Finally, it was cooled to room temperature at a rate of 10 K/h. The color of the obtained ingots was bright gray and seemed to be homogeneous.
2.2. Powder X-ray diffraction
The specimen of CuFeInTe3 for XRD measurements was ground in an agate mortar and pestle to a particle size of fewer than 106 µm. Powder X-ray diffraction pattern was collected at room temperature (298 K) on a PANalytical X’Pert Pro MPD powder X-ray diffractometer operating in Bragg-Brentano geometry using CuKα radiation (λ = 1.5418 Å). A tube power of 45 kV and 40 mA was employed. A nickel filter was used in the diffracted beam optics and the data were collected with the X’Celerator one-dimensional silicon strip detector. A 1/4◦divergent slit, a 1/2◦anti-scatter slit, and a 0.02 rad soller slit were set at both the incident and diffracted beams. The scan range was from 10 to 140◦2θ with a step size of 0.008◦and a scan speed of 0.0106◦/s. The analytical software package Highscore Plus (PANalytical, Almelo, Netherlands) was used to establish the positions of the peaks from the α1 component, strip mathematically the α2 component from each reflection, and to determine the peak intensities of the diffraction peaks (Table I). For the Rietveld refinement, the whole diffraction data was used.
TABLE I X-ray powder diffraction data of the quaternary CuFeInTe3.
| 2θobs(◦) | dobs(Å) | (I/I0)obs | h | k | l | 2θcal(◦) | dcal(Å) | ∆2θ(◦) |
| 16.001 | 5.5341 | 1.0 | 1 | 0 | 1 | 15.994 | 5.5367 | -0.007 |
| 24.896 | 3.5734 | 100.0 | 1 | 1 | 2 | 24.889 | 3.5743 | -0.007 |
| 25.920 | 3.4345 | 3.1 | 1 | 0 | 3 | 25.915 | 3.4352 | -0.005 |
| 28.829 | 3.0942 | 1.9 | 2 | 0 | 0 | 28.826 | 3.0945 | -0.003 |
| 0 | 0 | 4 | 28.800 | 3.0973 | ||||
| 33.141 | 2.7008 | 6.4 | 2 | 1 | 1 | 33.135 | 2.7013 | -0.006 |
| 1 | 0 | 5 | 39.126 | 2.3003 | ||||
| 39.143 | 2.2994 | 1.6 | 2 | 1 | 3 | 39.146 | 2.2992 | 0.003 |
| 41.199 | 2.1892 | 47.0 | 2 | 0 | 4 | 41.201 | 2.1891 | 0.002 |
| 41.222 | 2.1881 | 30.8 | 2 | 2 | 0 | 41.220 | 2.1882 | -0.002 |
| 44.487 | 2.0348 | 2.6 | 3 | 0 | 1 | 44.482 | 2.0350 | -0.005 |
| 1 | 1 | 6 | 48.720 | 1.8674 | ||||
| 48.755 | 1.8662 | 26.0 | 3 | 1 | 2 | 48.753 | 1.8662 | -0.002 |
| 53.819 | 1.7019 | 0.9 | 1 | 0 | 7 | 53.828 | 1.7016 | 0.009 |
| 3 | 2 | 1 | 53.874 | 1.7003 | ||||
| 55.509 | 1.6540 | 0.8 | 3 | 2 | 2 | 55.502 | 1.6542 | -0.007 |
| 58.136 | 1.5854 | 1.9 | 3 | 0 | 5 | 58.134 | 1.5854 | -0.002 |
| 3 | 2 | 3 | 58.148 | 1.5851 | ||||
| 59.650 | 1.5487 | 2.5 | 0 | 0 | 8 | 59.653 | 1.5486 | 0.003 |
| 59.712 | 1.5472 | 4.1 | 4 | 0 | 0 | 59.711 | 1.5473 | -0.001 |
| 2 | 1 | 7 | 62.205 | 1.4911 | ||||
| 62.239 | 1.4904 | 0.9 | 0 | 4 | 1 | 62.247 | 1.4902 | 0.008 |
| 3 | 1 | 6 | 65.674 | 1.4205 | ||||
| 65.704 | 1.4199 | 8.4 | 3 | 3 | 2 | 65.702 | 1.4199 | -0.002 |
| 66.161 | 1.4112 | 1.7 | 3 | 2 | 5 | 66.170 | 1.4110 | 0.009 |
| 4 | 1 | 3 | 66.183 | 1.4108 | ||||
| 67.589 | 1.3848 | 0.7 | 2 | 0 | 8 | 67.584 | 1.3849 | -0.005 |
| 4 | 0 | 4 | 67.624 | 1.3842 | ||||
| 73.732 | 1.2839 | 0.7 | 4 | 1 | 5 | 73.733 | 1.2839 | 0.001 |
| 75.078 | 1.2642 | 9.4 | 2 | 2 | 8 | 75.083 | 1.2641 | 0.005 |
| 4 | 2 | 4 | 75.122 | 1.2635 | ||||
| 77.379 | 1.2322 | 0.9 | 3 | 2 | 7 | 77.379 | 1.2322 | 0.000 |
| 4 | 3 | 1 | 77.418 | 1.2317 | ||||
| 80.509 | 1.1920 | 2.9 | 1 | 1 | 10 | 80.504 | 1.1921 | -0.005 |
| 3 | 3 | 6 | 80.555 | 1.1914 | ||||
| 81.017 | 1.1858 | 0.7 | 4 | 3 | 3 | 81.025 | 1.1857 | 0.008 |
| 82.786 | 1.1649 | 0.7 | 4 | 0 | 7 | 82.787 | 1.1649 | 0.001 |
| 5 | 1 | 3 | 82.818 | 1.1645 | ||||
| 84.551 | 1.1450 | 0.8 | 3 | 0 | 9 | 84.548 | 1.1451 | -0.003 |
| 4 | 1 | 7 | 84.573 | 1.1448 | ||||
| 88.075 | 1.1081 | 0.8 | 1 | 0 | 11 | 88.074 | 1.1081 | -0.001 |
| 89.441 | 1.0947 | 4 | 0 | 8 | 89.450 | 1.0946 | 0.009 | |
| 4 | 4 | 0 | 89.500 | 1.0941 | ||||
| 94.749 | 1.0468 | 2.0 | 3 | 1 | 10 | 94.752 | 1.0468 | 0.003 |
| 5 | 1 | 6 | 94.802 | 1.0464 | ||||
| 98.780 | 1.0146 | 0.7 | 4 | 1 | 9 | 98.789 | 1.0145 | 0.009 |
| 4 | 3 | 7 | 98.814 | 1.0144 |
3. Results and discussion
The experimental (Yobs in red) powder XRD pattern of CuFeInTe3 is shown in Fig. 2. An automatic search in the PDF-ICDD database [9], using the software available with the diffractometer, indicated that the powder pattern contained small amounts of Fe 1.125 Te (PDF N◦01-080-0280). Bragg positions of the diffraction lines from this compound are also indicated in Fig. 2. The 20 first peak positions of the main phase, CuFeInTe3, were successfully indexed using the Dicvol04 program [14], in a tetragonal unit cell with parameters slightly shorter than those of the ternary chalcopyrite parent CuInTe2 [2].
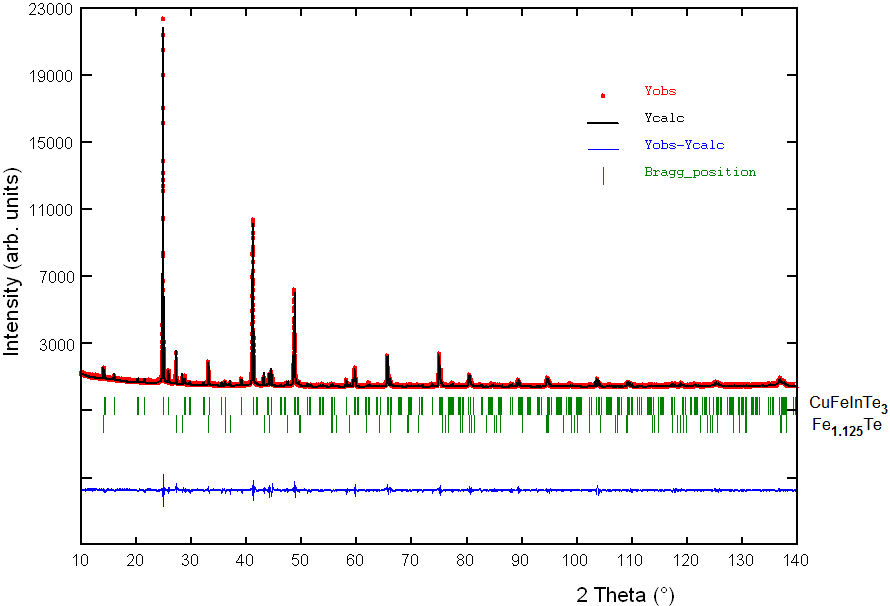
FIGURE 2 Rietveld refinement final plot of CuFeInTe3. The lower trace is the difference curve between observed and calculated patterns. The Bragg reflections are indicated by vertical bars.
A space group search using ExtSym program [15]
suggested the space group
The complete powder diffraction dataset was reviewed in the tetragonal space group
The Rietveld refinement technique [19] with the software Fullprof version 7.30, March 2020 [20] was used to determine the structure of CuFeInTe3.
The starting structure model used was that of the parent compound
CuFeInSe3 [21] and the unit
cell parameters were those obtained from the NBS*AIDS refinement. Atomic positions
of the Fe
1.125
Te binary [22] were included as a
secondary phase in the refinement. The peak profiles were described using a
parametrized pseudo-Voight function [23,24]. The background was described by the
automatic interpolation of 123 points throughout the whole pattern. With the
diffraction data available it was only possible to describe the thermal motion of
the atoms by one overall isotropic temperature factor. A total of 23 parameters of
the CuFeInTe3 compound were refined, including peak shape parameters,
scale factor, cell parameters, atomic coordinates, isotropic displacement
parameters, and full-width at half-maximum (FWHM) parameters. The final Rietveld
refinement led to agreement factors of: R
exp = 4.7%, R
p
= 5.5%, R
wp
= 6.1%, and S = 1.3,
respectively
Figure 2 shows the results of the Rietveld
refinement of CuFeInTe3. The calculated powder pattern is shown as a
solid black color line. The solid blue line is the difference between the calculated
and experimental powder XRD patterns. The vertical green lines show expected Bragg
diffraction peaks calculated as per space group
TABLE II Rietveld refinement results for CuFeInTe3.
| Molecular formula | CuFeInTe3 | Wavelength (CuKα) (Å) | 1.5418 |
| Molecular weight (g/mol) | 386.66 | Range 2θ(◦) | 10-140 |
| a(Å) | 6.1842(1) | Step size (◦) | 0.008 |
| c(Å) | 12.4163(2) | Counting Time (s) | 40 |
| V (Å3) | 474.85(1) | N◦intensities | 4501 |
| η = c/2a | 2.01 | Independent reflections | 322 |
| System | tetragonal | Rexp(%) | 4.7 |
| Space group |
|
(N◦112) Rp (%) | 5.5 |
| Z | 8/3 | Rwp(%) | 6.1 |
| ρx (g cm−3) | 5.753 | S | 1.3 |
TABLE III Atomic coordinates, isotropic temperature factor, and selected geometric parameters (Å, ◦) for CuFeInTe3, derived from the Rietveld refinement. Bond valence sum (BVS) results are shown, M = (1/3Cu +1/3Fe +1/3In).
| Atom | Ox. | BVS | Wyck. | x | y | z | foc | B (A˚ 2) |
| Cu | +1 | 1.37 | 2c | 0 | 1/2 | 1/4 | 1 | 0.35(2) |
| Fe | +2 | 2.35 | 2e | 0 | 0 | 0 | 1 | 0.35(2) |
| In | +3 | 3.43 | 2b | 1/2 | 0 | 1/4 | 1 | 0.35(2) |
| M | 2f | 1/2 | 1/2 | 1/2 | 1 | 0.35(2) | ||
| Te | -2 | 2.37 | 8n | 0.2534(1) | 0.2563(1) | 0.1176(1) | 1 | 0.35(2) |
| Cu - Te | 2.665(1) | Fe - Te | 2.726(1) | In - Tei | 2.746(1) | |||
| Teii - Cu - Teiii | 107.8(1) x4 | Te - Fe - Tev | 111.0(1) x4 | Tei - In - Tevii | 110.6(1) x4 | |||
| Teii - Cu - Teiv | 112.8(1) x2 | Te - Fe - Tevi | 105.7(1) x2 | Tei - In - Teviii | 106.5(1) x2 | |||
Symmetry codes: (i) 0.5-x, 0.5-y, 0.5+z; (ii) y, x, z; (iii) 0.5-x, 0.5+y, 0.5-z; (iv) -y, 1-x, z; (v) -x, -y, z; (vi) y, -x, -z; (vii) 0.5-y, -0.5+x, 0.5-z; (viii) -0.5+x, -0.5+y, 0.5+z.
Bond valence sum (BVS):
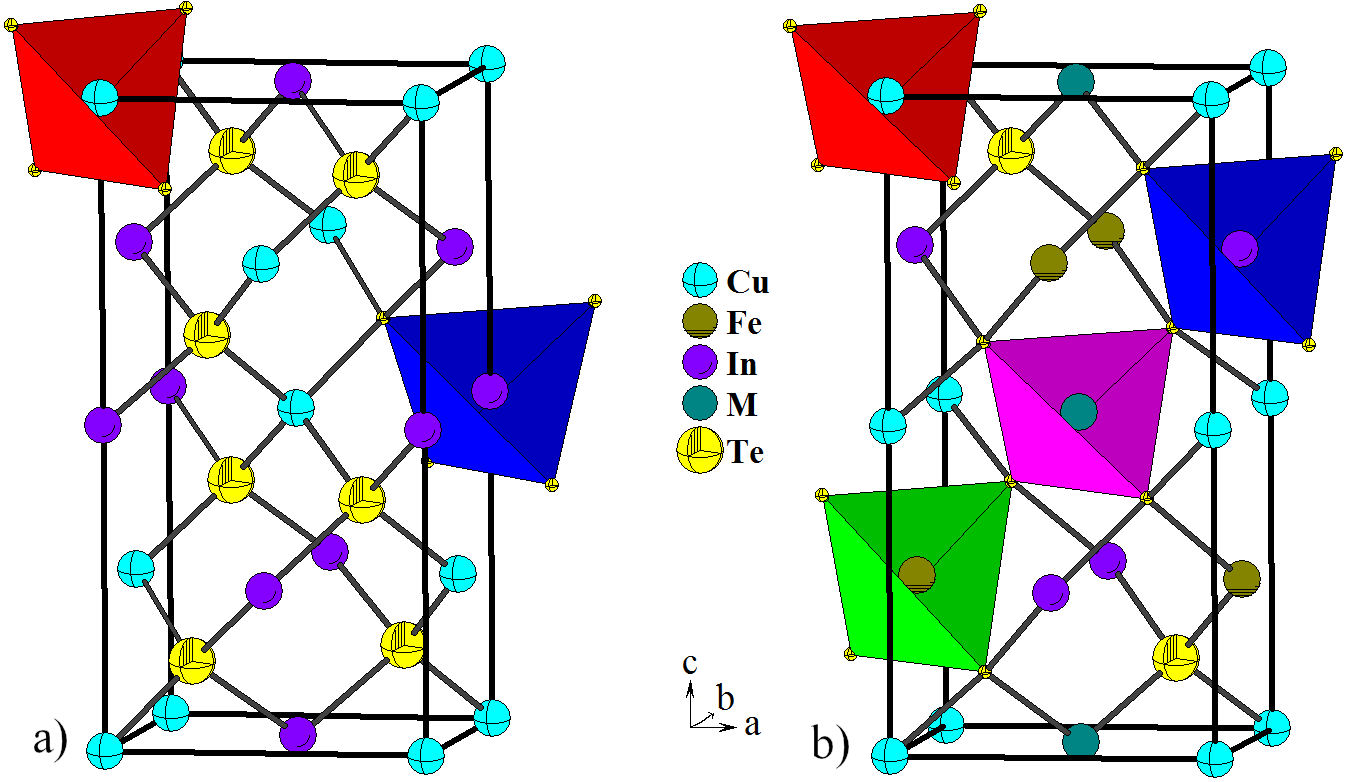
FIGURE 3 Unit cell diagram of the ternary CuInTe2 (
In this system (CuInTe2)
1−X
(ZnTe)
X
, with composition x = 0.5, introducing an
additional cation (Fe) to the ternary CuInTe2 leads to symmetry reduction
from the chalcopyrite structure
The interatomic Cu-Te [(2.665(1) Å], Fe-Te [2.726(1) Å], and In-Te [2.746(1) Å] are somewhat smaller than the sum of the respective ionic radii for structures tetrahedrally bonded [28]. However, correlates well with those found in the adamantane structures CuInTe2 [14], AgIn5Te8 [29], CuTa2InTe4 [30], Cu3NbTe4 [31], Fe2GeTe4 [32], Ag2FeGeTe4 [33], AgInTe2 [34], CuCo2InTe4 and CuNi2InTe4 [35], Cu3In7Te12 [36] and Cu3In5Te9 [37].
The Bond Valence Sum (BVS) values, for Cu, Fe, In, and Te were calculated using the Brown-Altermatt empirical expression [11,12]. The BVS of an atom i is defined as the sum of the bond valences V ij of all the bonds from atoms i to atoms j and the usually accepted empirical expression for BVS is V ij = exp[(R o −d ij )/B, where d ij is the interatomic distance and B is taken to be a “universal” constant equal to 0.37 Å. The values for the reference distance Ro are 2.27 Å, 2.53 Å, and 2.69 Å, for Cu-Te, Fe-Te, and In-Te, respectively [12]. The calculated oxidation states agree with the expected formal oxidation states for Cu+, Fe2+, In3+, and Te2− ions, whose results can also be seen in Table III.
4. Conclusions
The powder X-ray diffraction data and crystal structure of the super-paramagnetic semiconductor CuFeInTe3 is reported. This compound, refined by the Rietveld method, crystallizes in a P-chalcopyrite structure with a partially disorder cation distribution. Structurally it corresponds to a new adamantane compound and consists of a three-dimensional arrangement of slightly distorted CuTe4, FeTe4, and InTe4 tetrahedra connected by common corners. The chemical structural model was checked by analysis of the interatomic distances using the Bond Valence Sum (BVS) formula based on bondstrength examination.

