


 nueva página del texto (beta)
 Inglés (pdf)
 Artículo en XML
 Referencias del artículo
 Enviar artículo por email
 Citado por SciELO
  Similares en
SciELO
Similares en
SciELO 
 Permalink
Introduction
Geophysics has been applied in numerous studies to establish geological and tectonic compartmentalization in the last decades, as well as distinguishing lithotypes and identifying structures and lineaments, especially in inaccessible areas (Hallinan et al., 1993; Fernandes et al., 1995; Nogueira et al., 2004; Carvalho et al., 2006; Barbuena et al., 2013; Ramos et al., 2014; Castro and Ferreira, 2015; Gastal et al., 2015; Kosaroglu et al., 2016; Campos et al., 2017; Araffa et al., 2018; Weihermann et al., 2018; Osinowo and Abdulmumin, 2019; Alatorre-Zamora et al., 2020).
In most of these works, the qualitative geological-structural interpretation is usually facilitated when enhancement methods are applied. These emphasize certain characteristics of the geophysical data (primarily those related to potential fields). Several anomaly enhancement methods based mainly on the relationships between the derivatives of the magnetic and gravimetric fields have been published: vertical derivative (GZ - Evjen, 1936), analytic signal amplitude (ASA - Nabighian, 1972; Roest et al., 1992), total horizontal gradient (THDR - Cordell and Grauch, 1985), tilt angle (TDR - Miller and Singh, 1994), total horizontal gradient of the tilt angle (TDR_THDR - Verduzco et al., 2004), horizontal tilt angle (TDX - Cooper and Cowan, 2006), Theta Map (THETA - Wijns et al., 2005) and tilt angle of the horizontal gradient (TAHG - Ferreira et al., 2013). There are also quantitative methods used to estimate the depth and width of causative sources, such as Euler deconvolution (Thompson, 1982) and the Signum transform (de Souza and Ferreira, 2012, 2013, 2015; Oliveira et al., 2015, 2017).
The purpose of this paper is to present the application of qualitative and quantitative analyses of airborne and ground potential data to infer the structural mapping of subsurface and the configuration of cupriferous mineralizations. Although the Victor Teixeira and Capão Grande occurrences have already been the subject of geophysical studies (Moreira and Ilha, 2011; Pereira et al., 2016; Côrtes et al., 2016; Pereira et al., 2017; Côrtes et al., 2019; Bitencourt et al., 2020), this is the first study to our knowledge where a geophysical-structural framework is presented for the region.
Study Area and Geological Setting
The study area is located on the northwestern limit of the Caçapava do Sul municipality, Rio Grande do Sul state central region, Brazil (Figure 1a). The mining activity has great importance in the region of Caçapava do Sul due to numerous prospects, occurrences, and recognized polymetallic deposits. For example, the exploration of copper and gold that dates to the beginning of the 20th century (Ronchi and Lobato, 2000).
The geological regional context of the area is demarcated by a portion of contact between the Sul-Riograndense Shield and the Camaquã Basin (Figure 1b). The Sul-Riograndense Shield comprises the southern segment of the Mantiqueira Province, which encompasses 65,000 km2 of the south-central Rio Grande do Sul state. This shield is characterized by a wide spectrum of Precambrian igneous and metamorphic rocks, whose genesis is related to crust formation processes that occurred during the Trans-Amazonian/Eburian (Paleoproterozoic, 2.5 to 2.0 Ga) and Brasiliano/Pan-African (Neoproterozoic, 900-540 Ma) orogenic cycles (Almeida et al., 1981; Soliani Jr, 1986; Brito Neves and Cordani, 1991; Babinski et al., 1996; Hartmann et al., 2000). Regional structures of NE-SW, NW-SE, and N-S trending separated this shield in the Taquarembó, São Gabriel, Santana da Boa Vista, and Pelotas domains (Borba et al., 2006; CPRM, 2007; Borba et al., 2008).
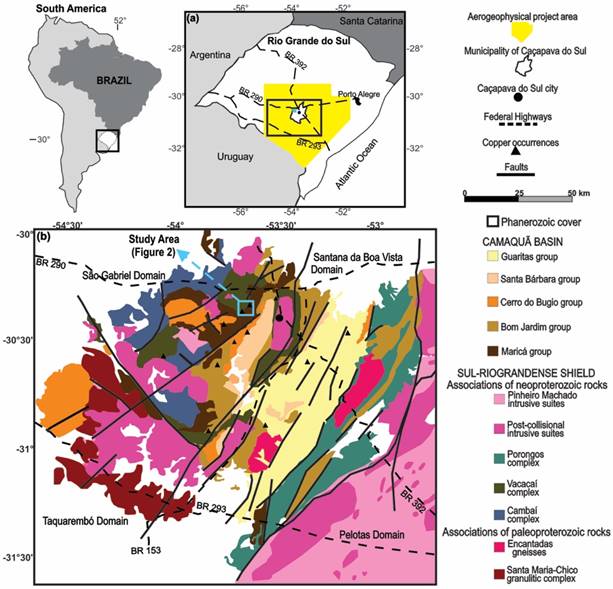
Figure 1 Location map indicating the main access roads (a) and the geological regional map of the study area (b) based on Almeida et al. (2005) and Borba et al. (2006).
The Camaquã Basin, which has the Sul-Riograndense Shield as basement, is composed of sedimentary and volcanogenic sequences (dated from 620 to 450 Ma) and has 10,000 m of thickness in an area of approximately 32,000 km2 in the main trend, i.e. N30E (Almeida et al., 1981; De Ros et al., 1994; Fragoso-Cesar et al., 2000; Paim et al., 2000; Teixeira et al., 2004; Almeida et al., 2010). These sequences do not show significant features of regional metamorphism and are delimited by high-angle major faults with NNE-SSW direction and basement highs, such as Caçapava do Sul to the west, and Serra das Encantadas to the east (Almeida et al., 2009).
According to Paim et al. (2000), Janikian et al. (2003), CPRM, (2007) and Almeida et al. (2010), the Camaquã Basin filling sequence can be subdivided into five main groups: Maricá (fluvial sandstones and marine fine-grained sandstones), Bom Jardim (lacustrine sandstones; conglomerates, rhythmites, and mudstones; intermediate, basic and acid volcanic and volcanoclastic rocks), Cerro do Bugio (volcanoclastic rocks and acidic volcanic), Santa Bárbara (alluvial sandstones, conglomerates, and rhythmites), and Guaritas (alluvial sandstones and conglomerates; aeolian sandstones). These groups are separated by angular unconformity and are also subdivided into formations, dominantly limited by unconformities.
Locally, the geological context in the study area (Figure 2a) is composed of outcropped rocks from the Vacacaí Metamorphic Complex (Sul-Riograndense Shield), the Passo da Promessa and Arroio América Formations (Maricá Group) and the Acampamento Velho Formation (Cerro do Bugio Group). Also, the area presents the Victor Teixeira and Capão Grande cupriferous occurrences and E-W, NE-SW and NW-SE trending faults.
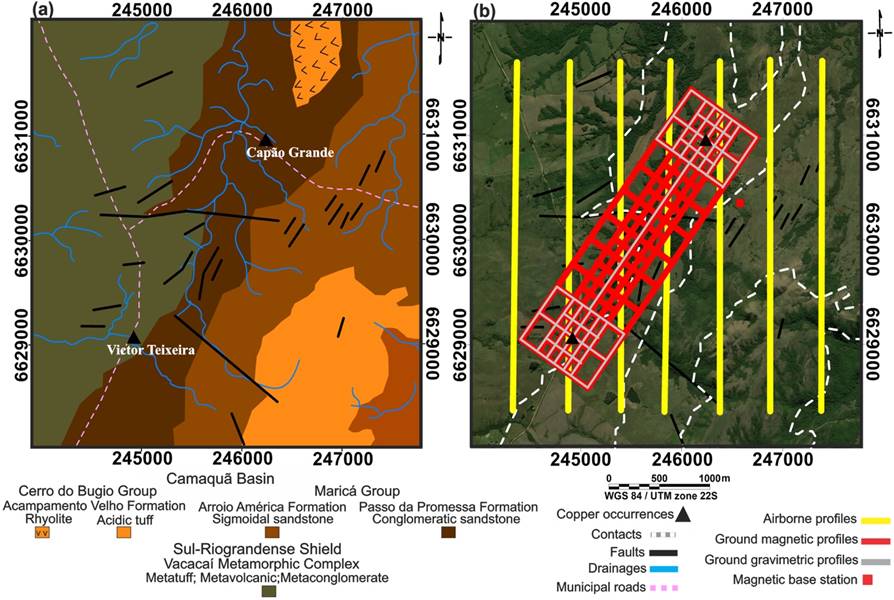
Figure 2 Geological local map of study area (a) based on CPRM (1995) and the configuration of potential field data profiles (b). Note that the ground gravimetric lines are situated over the ground magnetic ones.
The Vacacaí Metamorphic Complex (750 Ma) is constituted by a wide association of volcanic, volcanoclastic, and sedimentary rocks, which were metamorphosed primarily by younger post-tectonic Brazilian granitic intrusions into greenschist facies, phyllites, quartzites, marbles, hornblende schists, and chloritic schists, as well as magnesian sequences (Machado et al., 1990; CPRM, 2000). The complex has four main deformation phases recognized by regional structures. The first three phases generated coaxial faults and folds with NE-SW oriented axes which plunge 50° to the northwest. The first two events are expressed in a tangential movement while the third is characterized by shear. The last phase of deformation resulted in faults and folds with axes oriented to NW-SE and E-W, which were produced by a strong reorientation in the stress system (Koppe, 1990; CPRM, 1995; Remus et al., 1999).
In this unit, fine-grained yellowish-cream-gray quartzites with foliated texture were identified. These rocks are highly fractured and fracture-filled with quartz veins (Figure 3a). Also, subordinate metapelites outcropped in the area (Figure 3b). Both quartzites and metapelites denote low-grade metamorphism features.
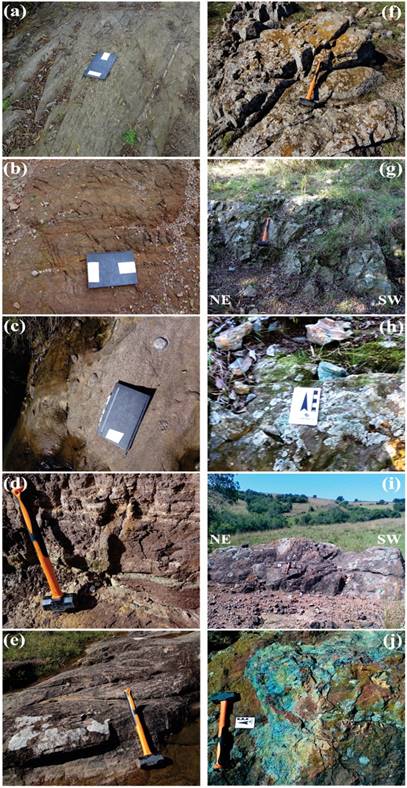
Figure 3 Main lithotypes found in the study area: (a) quartzites; (b) metapelites; (c) conglomeratic sandstones; (d) intercalations of sandstones and pelites; (e) trough cross-stratification; (f) rhyolites; (g) outcrop of Victor Teixeira copper occurrence; (h) malachite in Victor Teixeira; (i) outcrop of Capão Grande copper occurrence; and (j) azurite and malachite in Capão Grande.
The Passo da Promessa Formation corresponds to the bottom unit of the Maricá Group, dominated by cross-stratified sandstones and subordinate conglomerate lenses, interpreted as deposits of river plains of braided channels. The Arroio América Formation is the top unit of the Maricá Group and includes sandstones and conglomeratic facies generated in system of river plains of braided channels, associated with distal portions of alluvial fans. These formations were affected by a compressive tectonic event originating folds with low and high angle faults generating drags and interstrata displacements, and small sheath folds along low-angle fault planes leading to the interpretation of layer duplication (Pelosi and Fragoso-Cesar, 2003).
The Passo da Promessa Formation unit presents medium to coarse-grained reddish-brown and yellowish-white sandstones, often conglomeratic, poorly sorted, angular to subangular grains, often with rounded quartz pebbles, granites, and metamorphic rocks (Figure 3c). There are also sandstones intercalated with thin layers of pelites (Figure 3d) and trough cross-stratification of metric to decametric thickness is common (Figure 3e).
The Acampamento Velho Formation is the top unit of the Cerro do Bugio Group and represents the record of sodium alkaline affinity volcanism related to a post-orogenic extensional tectonic environment of approximately 700 m thick (Sommer et al., 1999; Janikian et al., 2005). This explosive-effusive volcanism is predominantly acid and formed in a subaerial environment associated with lavas and dikes of basic composition (Sommer et al., 2011; Matté et al., 2012). Outcrops of elongated tabular grayish-brown rhyolites oriented in the NE direction, which were described in the Acampamento Velho Formation (Figure 3f), were frequently observed in the sandstones of the Passo da Promessa Formation, near the Victor Teixeira occurrence (see Figure 2a). The rhyolites emplaced the weakened contact zone between the basement and the Camaquã Basin during the post-orogenic magmatic events (Borba et al., 2007).
The Victor Teixeira cupriferous occurrence, hosted at the Metamorphic Complex Vacacaí (see Figure 2a), is characterized by an outcrop in the NE-SW direction that presents 5 m length and 2 m width (Figure 3g). Chlorite-quartz-sericite schists and sericite-chlorite-quartz schists with gray to greenish-gray colors constitute the outcropping rocks. In addition, small impregnations of malachite [Cu2(CO3)(OH)2] were observed in fractures and in the interfoliar spaces (Figure 3h).
The Capão Grande occurrence is present in the Passo da Promessa Formation, the bottom unit of the Maricá Group in the Camaquã Basin (see Figure 2a). This mineralization is characterized by an outcrop in the NE-SW direction, showing 19 m in length and 10 m in width (Figure 3i), composed of intensely fractured medium-grained and reddish-brown arkosic sandstones. These sandstones host azurite [Cu3(CO3)2(OH)2] and malachite [Cu2(CO3)(OH)2], which mainly fill fractures (Figure 3j).
The literature on the origin of several prospects, occurrences and deposits of metallic minerals (Au, Ag, Cu, Pb and Zn) present and the Camaquã Basin shows contrasting interpretations due to the variety of models proposed. The most recent explanation for their origin is that they are associated with a magmatic-tectonic system developed in the post-collisional period of the Dom Feliciano Belt, at the end of the Brasiliano Cycle. The plutono-volcanic events recorded in the basin would have acted as thermal sources in the generation of epithermal systems. In addition, these events may be responsible for the circulation of paleofluids and for the remobilization of metals from country rocks and their later concentration (Remus et al., 2000; Mexias et al., 2007; Toniolo et al., 2007; Fontana, 2016).
The structural control of those important concentrations of metallic minerals is intrinsically associated with the tectonic episodes of generation and deformation of the Camaquã Basin over the Sul-Riograndense Shield. According to Almeida et al. (2010), two paleostress fields, related to forming tectonic events, and three later ones were recognized, which were associated with deforming tectonic events. The two first fields were associated with ENE-trending distension and ENE-trending compression while the others were related to NW-oriented distension, NW-oriented compression, and NE-oriented distension. Also, the first paleostress corresponds to the N20-30E trend Irapuá Fault (Ribeiro et al., 1966) while the second is associated with the N50-60W oriented Cerro da Vigia Fault (Ribeiro, 1970).
Material and Methods
The airborne magnetic data used in the present research was acquired and processed by Lasa Prospecções S/A for the Geological Survey of Brazil (CPRM, 2010). The Aerogeophysical Rio Grande do Sul Project covered an area of approximately 75,600.00 km2 and its survey lines were spaced 500 m (north-south oriented) while its control lines have a spacing of 10 km. The average nominal ground clearance was 100 m. The magnetic field was acquired using a Scintrex CS-2 cesium magnetometer that uses a GPS navigation system with 12-channel receivers and a TRIMBLE AgGPS 132 differential correction model. The along-line sample interval was 0.1 s, which represented a spatial sampling of approximately 6 m.
The limits of the Aerogeophysical Rio Grande do Sul Project is illustrated in Figure 1a and the flight-lines used in the 16 km2 of study are shown in Figure 2b. The length of each of the seven lines was 3,200 m.
The ground magnetic data consisted of 1,258 measurements acquired in a parallel and perpendicular arrangement to the cupriferous occurrences of Victor Teixeira and Capão Grande (Figure 2b). These profiles were collected using a sampling interval of 25 m and they present different lengths, e.g. 400 m, 800 m, and 2,925 m. Two GSM-19 (GEM SYSTEMS) proton precession magnetometers were used for the ground survey where one of them acted as a base station to assess the daily magnetic variation. In addition, the readings were defined according to the magnetic datum (22,475 nT) obtained from the National Oceanic and Atmospheric Administration (NOAA) for the center of the study area.
The acquisition of ground gravimetric data was restricted to two smaller areas around the copper occurrences and along a NE-SW profile that connects them (Figure 2b). Gravity acceleration measurements were spaced 25 m in the profiles that crosscut the mineralized outcrops and 50 m along the others. A total of 441 stations were acquired using a Scintrex Autograv CG-5 gravimeter.
The procedure adopted in obtaining the gravimetric data was to use a known base station to start the survey, then proceeding to the stations scheduled and at the end of day measuring at the initial base station. The Autograv CG5 gravimeter was configured so that measurements were sampled at both the base station and stations of interest after a 90 s cycle of continuous readings.
The Main Church of Caçapava do Sul was used as a reference base station. This station, which is a member of the Fundamental Gravity Network of Brazil, has the following properties: absolute gravity of 979,274.670 mGal, altitude of 444.895 m, and UTM coordinates of 260,050.493 X and 6,621,240.062 Y.
The georeferencing of gravimetric stations was performed using two GPS/GLONASS/SBAS L1/L2 receivers, ProMark 700 models, from Spectra Precision. These models were developed for use in Real-time Kinematic Network (RTK) and present Global Satellite Navigation System (GNSS) with 200 channels achieving horizontal and vertical accuracies of 10 mm and 20 mm, respectively.
The Geological Survey of Brazil made the data of the Rio Grande do Sul Shield aerogeophysical project (CPRM, 2010) available in the ASCII format (.xyz). In addition, the survey data already includes routine magnetic corrections (parallax error; removal of diurnal variations; leveling and microleveling of profiles, and subtraction of the International Geomagnetic Reference Field - IGRF). Therefore, the processing carried out included clipping the area of interest and to grid its database in the dimensions 125 m x 125 m (equivalent to 1/4 of the spacing between flight lines), using the bidirectional interpolation method (Reeves, 2005; Isles and Rankin, 2013).
Regarding the ground magnetic data processing, after removal of spurious data, the magnetic field was corrected for diurnal variations and the IGRF was subtracted (Luiz and Silva, 1995; Milsom, 2003; Dentith and Mudge, 2014). In addition, the diurnal correction calculation was performed in the GEMLink software and the IGRF subtraction (according to the World Magnetic Model corrected in 2018) using the Oasis Montaj program.
The ground gravimetric data were also reduced according to standard procedures in the literature, such as instrumental drift, tidal effects, latitude, altitude, and terrain corrections, as well as the calculation of the free-air and Bouguer anomalies (Telford et al., 1990; Kearey et al., 2002; Lowrie, 2007; Hinze et al., 2013). The free-air and Bouguer anomalies were defined according to the latitude equation of Heiskanen and Moritz (1967) and an average crustal density of 2.67 g/cm3. The terrain correction was developed based on the correlation of altimetric data from local stations and the digital elevation model derived from the Shuttle Radar Topography Mission (SRTM) data. This correlation was based on the methods described by Kane (1962) and Nagy (1966) using the Gravity extension from the Oasis Montaj software.
The last stage of ground geophysical data processing was to generate magnetic and gravimetric maps using the minimum curvature interpolation (Briggs, 1974) in a regular mesh of 37.5 m (1/4 of the average spacing between acquisition lines).
For the stage of anomalies enhancement, qualitative and quantitative analyses were performed for all the previous corrected data. The qualitative analysis was based on enhancement techniques, such as the TDR (Miller and Singh, 1994) and THETA (Wijns et al., 2005), to evaluate the study area’s structural framework. These techniques were applied directly in the reduced-to-the-pole magnetic field airborne data while the ground magnetic and ground Bouguer data were upward continued to improve the signal/noise ratio.
The quantitative analysis involved the Euler deconvolution (for the airborne and ground data) and the radially averaged power spectrum (for the ground data) to estimate the depths of the causative sources and delineate the structural framework. Also, the power spectrum assisted in defining the values used for the upward continuation of the ground magnetic (40 m upward continued) and gravimetric (50 m upward continued) data.
The reduction-to-the-pole is a filter commonly used to minimize the dipolar effect of the geomagnetic field. This technique transforms the anomaly into the shape it would have if it were on the magnetic pole, i.e. inclination (I) = 90°; declination (D) = 0° (Baranov, 1957; Baranov and Naudy, 1964). Although the reduction-to-the-pole considers only the induced magnetization, it allows the anomalies to be positioned as close as possible to the causative sources by means of the following expression (Grant and Dodds, 1972; MacLeod et al., 1993a, 1993b; Li, 2008):
where I is the geomagnetic inclination, D is the geomagnetic declination, θ is the direction of the wavenumber, and Ia is the amplitude correction inclination, or pseudo-inclination, which is the complementary angle of the geomagnetic inclination.
MacLeod et al. (1993a, 1993b) introduced pseudo-inclination to obtain more stable responses at low magnetic inclinations (case of the study area). This parameter also suppresses amplitude and power in the direction of the inclination (Li, 2008).
The values used in the reduction to pole, according to Eq. 1, of the airborne magnetic survey were D = -13.47°, I = -36.60° and Ia = -53.40° while the parameters for the ground magnetic survey were D = -14.99°, I = -38.79° and Ia = -51.21°. Those parameters were adopted according to the acquisition of survey data average date, which were June 22, 2010, and December 17, 2017, for the airborne and ground magnetic surveys, respectively.
The TDR is defined as the arctangent of the ratio between the vertical derivative (Gz) and the total horizontal derivative (THDR):
This enhancement technique responds equally well to shallow and deep sources and can provide information about their horizontal extensions, due to its property of being positive above the sources, reaching zero values close to the edges and negative outside them (Miller and Singh, 1994). The TDR also provides estimates on the dip and the magnetic susceptibility contrast of the causative sources (Thurston and Smith, 1997; Salem et al., 2007; Fairhead et al., 2008).
The THETA is considered as the quotient between THDR and the analytic signal amplitude (ASA):
This filter is commonly used to outline contacts and it has the property of locating anomalies directly over their causative sources. Even though it was initially developed for regions with low magnetic latitudes, the THETA may be applied to reduced-to-pole data (Wijns et al., 2005).
The upward continuation (UW) simulates the acquisition of data at heights higher the level at which the data were measured, that is, further from the sources. This filter minimizes or removes the high-frequency and noise signals and it does not produce edge effects. The UW is often used to compare magnetic and gravimetric data acquired at different altitudes (Jacobsen, 1987; Milligan and Gunn, 1997).
The Euler deconvolution is a quantitative technique applied in a set of potential anomalies that allows estimating the location and depth of causative sources based on data scanning through moving windows (Thompson, 1982; Blakely, 1995). These estimates, called solutions, are calculated based on the inversion of the Euler’s homogeneity equation, which relates the magnetic and gravimetric fields and their horizontal and vertical derivatives alongside the location of the sources through the degree of homogeneity, interpreted as structural index:
where x0, y0, z0 are the magnetic source positions, x, y, z are the positions of the detected total field M, B is the regional value of the total magnetic field, and η is the degree of homogeneity or structural index.
The structural index (SI) may be defined as the rate of change of the potential field’s strength compared to the distance between the source and the detector for a given model geometry. The interpreter should always choose the index based on prior geological knowledge where features receive a corresponding structural index based on their generic geometric shape (Table 1). The degree of Euler's solutions concentration is acceptable when the solutions are aligned on 2D models, or superimposed on 3D models (Reid et al., 1990).
Table 1 Structural index (SI) values for magnetic and gravimetric models (Reid et al. 1990).
| Magnetic Bodies | Structural Index | Gravimetric Bodies | Structural Index |
|---|---|---|---|
| Contact/Step | 0 | Step/Sill/Dike | 0 |
| Sill/Dike | 1 | Cylinder/Pipe | 1 |
| Cylinder/Pipe | 2 | Sphere | 2 |
| Sphere | 3 |
The radially averaged power spectrum is another quantitative method to estimate the depth of potential field anomalies in the frequency domain, enabling the spectrum to delimit the deep, intermediate, shallow, and noise sources, which is used to perform the regional-residual separation. In addition, the power spectrum expresses the energy corresponding to the wavenumber and direction in the form of a two-dimensional graph, whose x-axis represents the wavenumber and y-axis the power spectrum energy logarithm, that is log E(r), which is equivalent to 4πr. Depth to a set of statistical sources is given by the following equation (Spector and Grant, 1970; Cowan and Cowan, 1993):
where h is the depth to the top of the sources and s is the slope of one portion of the power spectrum.
Results and Discussions
The results generated from the airborne and ground geophysical data are illustrated (Figures 4, 5 and 7) in pseudo-colored contour maps alongside the geological map of Figure 2a. The total-field anomaly (TFA) map (Figure 4a), shows values varying between -5 nT and 10.5 nT in both Vacacaí Metamorphic Complex and Camaquã Basin. Only Acampamento Velho Formation’s tuffs and rhyolites have a predominance of negative values, around -3 nT. The faults were characterized by anomalies of high magnetic intensity (above 1 nT) while the cupriferous occurrences were located at the edges of positive anomalies (NE-SW trend in the Victor Teixeira and NW-SE direction in Capão Grande).
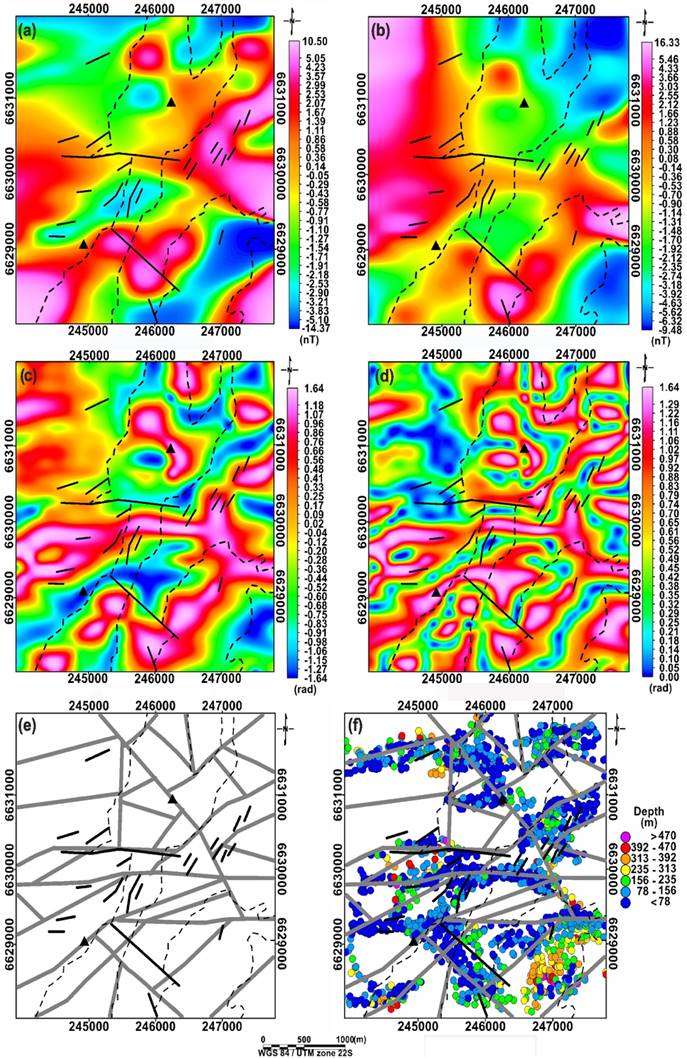
Figure 4 Airborne magnetic maps: (a) TFA; (b) RTP-TFA; (c) TDR of the data in (b); (d) THETA of the data in (b); (e) magnetic lineaments interpreted (gray lines); (f) Euler solutions. Dashed lines represent the contacts between the lithotypes while solid lines are faults (i.e, limits and structures of Figure 2a).
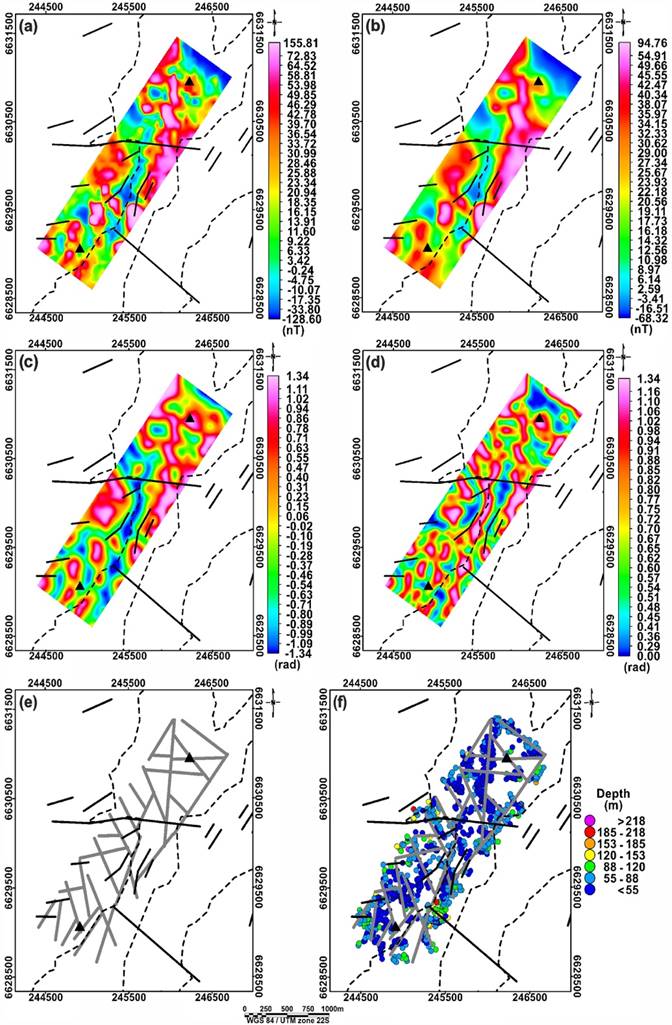
Figure 5 Ground magnetic maps: (a) RTP-TFA; (b) RTP-TFA upward continued (UW) to 40 m; (c) TDR of the data in (b); (d) THETA of the data in (b); (e) magnetic lineaments interpreted (gray lines); (f) Euler solutions. Dashed lines represent the contacts between the lithotypes while solid lines are faults (i.e, limits and structures of Figure 2a).

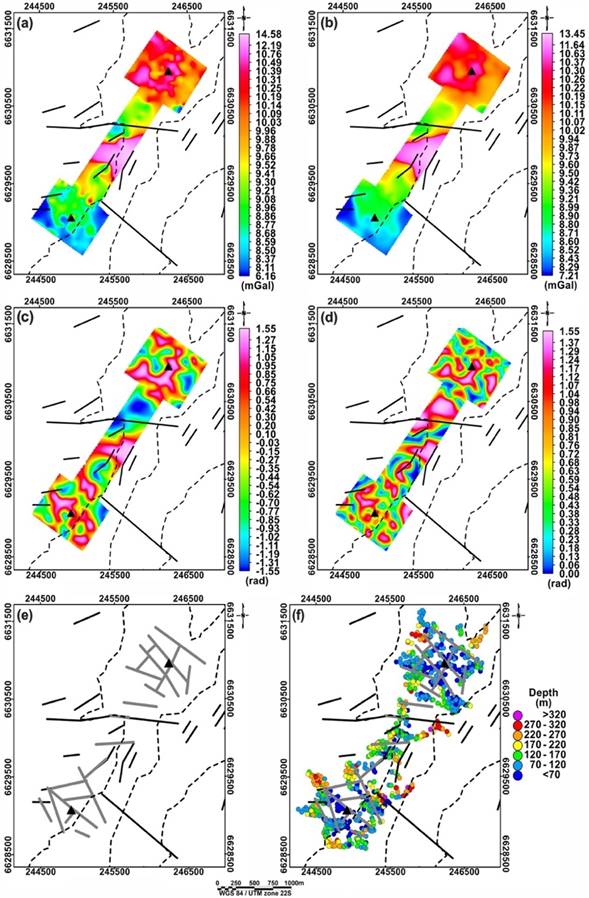
Figure 7 Ground gravimetric maps: (a) Bouguer anomaly; (b) Bouguer anomaly upward continued to 50 m; (c) TDR of the data in (b); (d) THETA of the data in (b); (e) gravimetric lineaments interpreted (gray lines); (f) Euler solutions. Dashed lines represent the contacts between the lithotypes while solid lines are faults (i.e, limits and structures of Figure 2a).
A successful application of the RTP to the TFA (RTP-TFA) map can be seen in Figure 4b, where the total-field dipolar anomalies become monopolar and the RTP-TFA maximum values are higher than those of the TFA map. The basement metavolcanoclastic rocks are characterized mainly by high amplitudes (between 1 nT and 16 nT) while the volcano-sedimentary rocks of Camaquã Basin have low to intermediate values (from -9 nT to -0.90 nT), which are in good agreement with their lithotypes. There are also positive anomalies in the basin, above 0.30 nT, in the NE-SW (delimiting the tuffs) and NW-SE to E-W directions (parallel to the geological regional faults). The domain of intermediate magnetic field (around -0.90 nT) is associated with the cupriferous occurrences.
Figures 4c and 4d show the results of TDR and THETA enhancement techniques. These filters were used to delineate structural lineaments in the study area since they demonstrated greater coherence with the prior geological information in comparison to the results obtained from previous methods cited in the Introduction section. Moreover, both TDR and THETA equalize the amplitudes and locate the maxima over the center of the magnetic sources.
Regarding the magnetic-structural framework of the study area (Figure 4e), the metavolcanoclastic sequence of the Vacacaí Metamorphic Complex exhibits lineaments in the NE-SW and E-W directions. Moreover, the main geological structure of this complex, an E-W fault, showed a good magnetic response. Immediately to the south, another E-W magnetic structure, that crosses the region, was delineated. Magnetic lineaments with NW-SE and NE-SW direction predominate in the volcano-sedimentary sequences of the Camaquã Basin. The larger NW-SE geological fault is parallel to a magnetic lineament. The magnetic lineaments suggest that the Capão Grande copper occurrence (located at the north in the basin) is controlled by an NW-SE oriented structure while the Victor Teixeira occurrence (located at the southwestern rim of the basin) is associated with a NE-SW oriented lineament.
Figure 4f shows the Euler solutions, generated from the RTP-TFA data (Figure 4b). The parameters used for the solutions were: structural index (SI) equal to 0 (Contact/Step - Table 1), depth tolerance of 25 %; window size of 1,000 m, and flight height of 113 m (average value for the study area). The solutions were mostly located in the E-W, NE-SW, and NW-SE directions, thus in good agreement with the interpreted lineaments. The maximum and minimum depths observed were 570 m and 1 m, respectively. Most of the magnetic lineaments are situated at depths between 78 m and 156 m. Larger depths (between 235 m and 313 m) were observed mainly in the acidic tuffs of the Acampamento Velho Formation.
Figure 5a shows the RTP-TFA map of the ground magnetic data of the study area. The metavolcanoclastic rocks of the Vacacaí Metamorphic Complex are characterized mainly by high-intensity anomalies (above 36 nT), with Victor Teixeira occurrence located on the edge of one of those. From this occurrence towards the central region of the map, the contact with the Passo da Promessa Formation sandstones is practically outlined by low magnetic intensities (about -10 nT). This signature continues northward to the E-W regional geologic fault, where the magnetic field increases in the Capão Grande occurrence direction. RTP-TFA values increase as they approach the Arroio América Formation.
The RTP-TFA map upward continued to 40 m can be seen in Figure 5b, in which a smoother pattern of anomalies is observed. The height of upward continuation, 40 m, was set according to the Radially Power Averaged Spectrum (Figure 6a) analysis, which was generated from the data RTP-TFA map of ground magnetic data (Figure 5a). In addition to the values attributed to shallow and noise sources, deep sources (> 200 m depth) and intermediate sources (between 200 m and 100 m) were also interpreted.
The TDR (Figure 5c) and THETA (Figure 5d) enhancement techniques from the RTP-TFA 40 m upward continued map enabled a satisfactory qualitative interpretation of the ground magnetic-structural framework (Figure 5e), where interconnected NW-SE, NE-SW, and E-W oriented structures can be seen. In this framework, NW-SE trend lineaments are more abundant, although NE-SW trend lineaments are longer. Observed NE-SW oriented lineaments may be associated with the contact between the Vacacaí Metamorphic Complex and the Camaquã Basin, south of the E-W central geologic fault. Intersections between NE-SW and NW-SE structures are recurrent in those geological units and are also observed in the Victor Teixeira and Capão Grande copper occurrences.
Euler solutions (Figure 5f) show good agreement with the interpreted lineaments. The depths were situated between 22 m and 250 m and were determined based on the following parameters: structural index (SI) equal to zero (Contact/Step); depth tolerance of 15%; window size of 300 m and distance between the sensor and the ground surface of 1.8 m. The lineaments were characterized by depths varying between 55 m and 88 m.
Ground Bouguer gravity anomalies of the study area ranged from 6.16 mGal to 14.58 mGal (Figure 7a). The southwestern area (Victor Teixeira occurrence) presents the lowest values (between 6.16 mGal and 9.21 mGal). In the central region, a strong E-W oriented anomaly (14.58 mGal) stands out. Positive anomalies of similar intensity predominate (10.09 mGal to 14.58 mGal) near the Capão Grande mineralization.
The attenuation of the signal without significant loss of geological information is evident in Figure 7b, which illustrates the ground Bouguer anomaly map upward continued to 50 m. The TDR (Figure c) and THETA (Figure 7d) enhancement techniques were applied to this map to outline the gravimetric-structural framework (Figure 7e), whose qualitative interpretation of the lineaments proved to be satisfactory with the mapped geology.
Preferential trends in the gravimetric-structural framework (Figure 7e) are observed in the NW-SE, E-W, and NE-SW directions. In the central area, E-W structures dominate (one of the lineaments is consistent with a part of the geologic regional fault) while the other lineament trends intersect near the copper occurrences.
Euler solutions (Figure 7f), based on the Bouguer anomaly data (Figure 7a), indicate depths between 19 m and 340 m, which were determined by the following parameters: SI equals to 0 (Contact/Step); depth tolerance of 15 %; window size of 300 m and height of 17 cm (distance between the gravimeter tripod and the surface). The solutions were consistent with the gravity observed structures (mainly those in the NW-SE trend). The lineaments interpreted around the copper mineralizations presented depths from 70 m to 120 m. The central E-W structures are deeper (between 120 m and 170 m). In addition, depths greater than 170 m are indicated in the innermost portions of the geological units and near to the contacts.
The assimilation of results obtained in the interpretative potential field maps (Figure 4e, Figure 5e, and Figure 7e) allowed us to present the interpretation of the integrated geophysical-structural framework of the study area (Figure 8a). Moreover, the surface structural lineaments can be observed in Figure 8b. They were delineated according to the analysis of shaded SRTM imagery (azimuths used: 0°, 45°, 90°, 135°, 180°, 225°, 270° and 315°) using the QGIS package.

The geophysical-structural picture of the study area (Figure 8a) reveals the interconnection of NE-SW, NW-SE and E-W lineaments, which may indicate a likely correlation between the copper mineralizations, as the lineaments may act as conduits for paleofluids, as well as for the remobilization of metals in the country rock and subsequent concentration of these elements. These processes may be related to an epithermal magmatic event associated with the post-collisional period of the Dom Feliciano orogenesis, which dates at the end of the Brasiliano Cycle (Remus et al., 2000; Toniolo et al., 2007; Mexias et al., 2007; Fontana, 2016).
The interpretation of orbital lineaments, presented in Figure 8b, also reveals a structural framework that connects the studied cupriferous occurrences. This validates the geophysical-structural framework results and suggests that such structures are significant in both shallow and deep levels.
Figure 8a and b indicate that NE-SW and NW-SE lineaments predominate compared to the E-W trend. NE-SW trends primarily are associated with geological contacts while NW-SE lineaments often intercept them, as in the case of cupriferous occurrences. In addition, there is a good correlation between orbital and airborne (magnetic) and ground (magnetic and gravimetric) lineaments in the area of the occurrences, especially in NW-SE lineaments in Capão Grande and NE-SW in Victor Teixeira. In the central study area, there was a correspondence between orbital and geophysical lineaments in the E-W direction and the mapped geology, corroborating the main geological E-W oriented fault and still revealing another structure parallel to the south, which may crosscut all the geological units according to airborne magnetic data.
The main trends (NE-SW, NW-SE, and E-W) of the geophysical-structural framework and surface structures (Figure 8a and b) reflect the tectonic history of superposition of the four main deformation phases that affected the Vacacaí Metamorphic Complex and Maricá and Cerro do Bugio Groups in the study area. The first three phases resulted in the generation of faults and coaxial folds with NE-SW oriented axes (plunging 50° to NW) and the last deformation phase resulted in faults and folds with NW-SE and E-W oriented axes, produced by a strong reorientation in the stress system (Koppe, 1990; Machado et al., 1990; CPRM, 1995; Remus et al., 1999).
The remarkable interlacement of geophysical and orbital lineaments that characterizes the copper occurrences (Figure 8a e b) endorses the importance of these sites as prospective guides in mineral research campaigns in the study area. This is due to several prospects, occurrences, and polymetallic deposits from the Sul-Riograndense Shield and Camaquã Basin being located at the intersection of N20-30E (e.g. Irapuá fault system) and N50-60W oriented regional structures (e.g. Cerro da Vigia fault system) (Ribeiro et al., 1966; Ribeiro, 1970; Remus et al., 2000; Almeida et al., 2010).
In summary, based on the prospective guide mentioned before, it is possible to suggest a target area with a high potential for mineralization in the region between the copper occurrences, near the contact between the Vacacaí Metamorphic Complex and the Passo da Promessa Formation. In addition to the intersections of NE-SW and NW-SE structures in that region, an E-W structure crosscut all geological units. Moreover, this location stands out for its high values of depth (around 170 m) from Euler solutions.
Conclusions
The use of airborne and ground magnetic and gravity data confirmed its potential in the elaboration of geophysical-structural maps. These were based on the enhancements applied from qualitative techniques of the tilt angle (TDR) and the Theta Map (THETA) over the Bouguer anomalies and reduced-to-the-pole magnetic grids.
The solutions, which have structural index associated with geological contacts derived from the quantitative Euler deconvolution, proved to be consistent with the lineaments interpreted by qualitative techniques. Such solutions pointed out that most of the delineated structures extend to at least 170 m in the subsurface.
The geophysical-structural framework obtained for the study area revealed a pattern of interconnected joints, faults, and fractures that may result in vertical conduits that are suitable for the circulation of mineral-rich fluids. These fluids are relevant in the formation and control of deposits in magma-hydrothermal systems, as recognized in several occurrences of base metals in the Sul-Riograndense Shield and in the Camaquã Basin, which supports the correlation between the Victor Teixeira and Capão Grande mineralizations, which are separated by a distance of 2,300 m.
The joint use of magnetic and gravity methods enabled the recognition of structural lineaments at different depths and association with different deformation phases. Our analyses of post-processing products suggest the prospective targets of mineral occurrences where there are intersections of geophysical-structural lineaments. These lineaments may present high values of depth. However, they lack detectable indicators in the surface geology.
The intersection pattern of NE-SW and NW-SE oriented geophysical-structural lineaments, which presents in the copper outcrops and related to different depths and deformational phases, constitutes a prospective guide for similar places where there is a lack of surface evidence. This prospective guide may contribute to identifying potential new targets in mineral research campaigns, as pointed out in the central region of the study area.

